It was very apparent during and after the 2008 crash that all my UK Income Investment Trusts maintained or increased their dividends. Of course, their share prices collapsed in line with the market but the income continued to flow and their share prices subsequently recovered. A year or so ago I took the decision to move out of individual shares into ITs. Firstly I went for some international diversification but now I am looking to move into some UK income ITs.
The market crash of 2008 provides the ideal opportunity to stress test the ITs and my hope was that it would be possible to have a short lists of trusts meeting these criteria:-
- A dividend yield at least equal to the FTSE All share yield (4.06%)
- Dividend growth since 2007 with no dividend cut
- Share price growth since 2007 at least equal to the FTSE All share (+28%)
- Healthy dividend cover
- Dividends paid from income not capital
The latter point is important as I have learnt the hard way from my holding in European Assets Trust (payout based upon nett asset value) that any trust that relies on capital gains to fund dividend payouts is highly like to cut the dividend when the market crashes. IA trust that primarily uses the dividends received from its stock holdings supplemented by dipping into revenue reserves during downturns is more likely to be able to maintains its dividend payouts during hard times.- A dividend yield at least equal to the FTSE All share yield (4.06%)
- Dividend growth since 2007 with no dividend cut
- Share price growth since 2007 at least equal to the FTSE All share (+28%)
- Healthy dividend cover
- Dividends paid from income not capital
Methodology
There are around 80 ITs that can be broadly classified as UK Income or Income & Growth. The three most useful resources for researching ITs are The Association of Investment Trust Companies (AIC) website, Trustnet and the Annual Reports and Accounts of each IT. AIC is particularly useful as it includes 10 year performance data, yield and 5 year dividend growth and dividend cover. The Annual Reports and Accounts are far more detailed than the reports for OEICs and usually include 10 year performance and dividend histories. Most IT websites provide downloads of accounts going back many years so it is relatively easy to compile data going back 15 to 20 years. I am always far more interested in performance during market downturns than performance during market recoveries or booms. The 5 year and 10 year histories that are commonly published now cover the post 2008 crash period which is not particularly helpful as it has been pretty easy since 2010 for any fund to increase share price and grow dividends.The table below provides a summary of the performance of a short list of 7 Investment Trusts looking at 5 year dividend growth, dividend cover, total return and share price growth since January 2007.
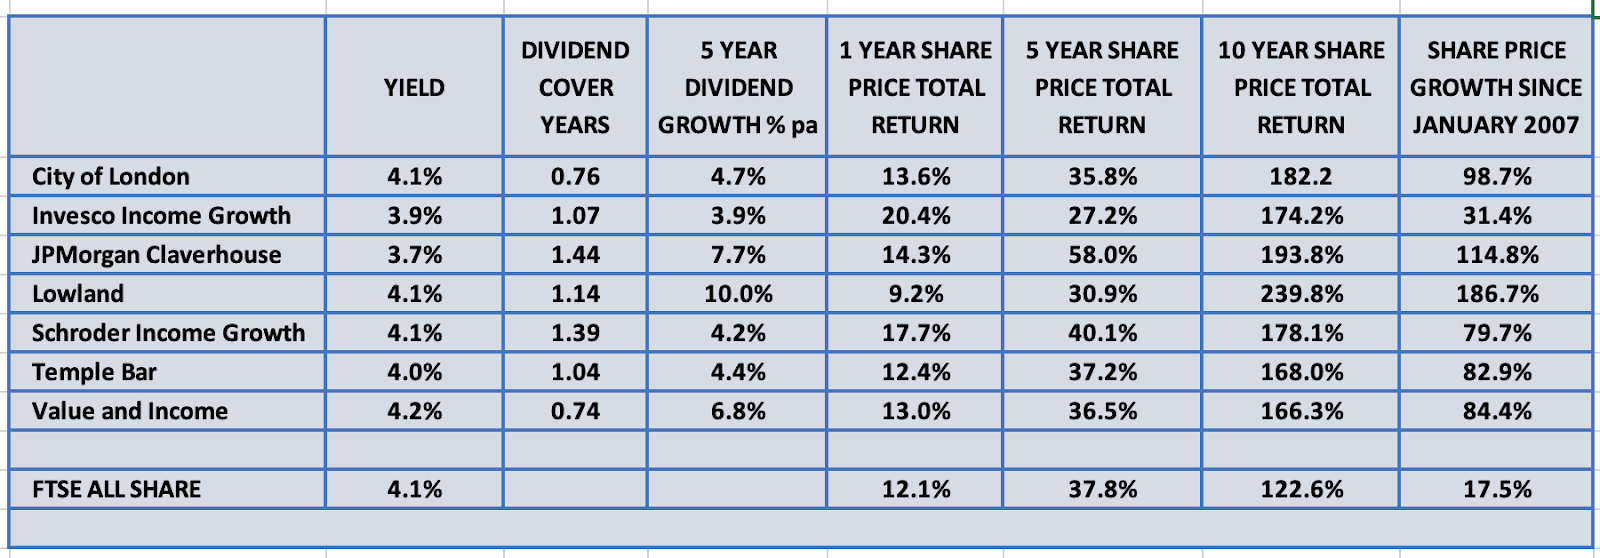 |
Performance of Short List |
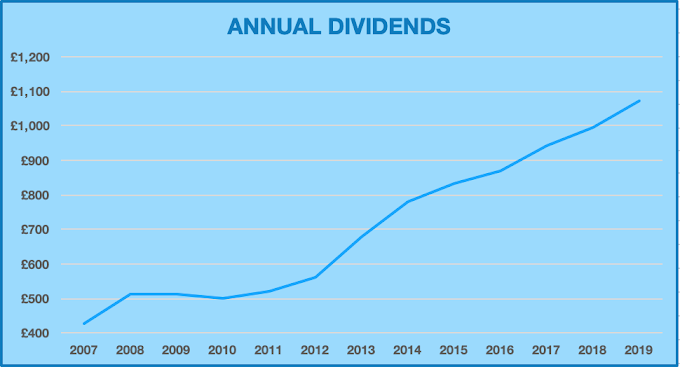
In order to see the dividend performance of the trusts during the market crisis of 2008 I assumed the purchase of £1000 of shares in January 2007 just before the market peaked and dug into the reports and accounts of each trust to obtain the dividend payments form 2007 to 2019 and converted this to annual payments based upon the assumed £1000 initial share holding.
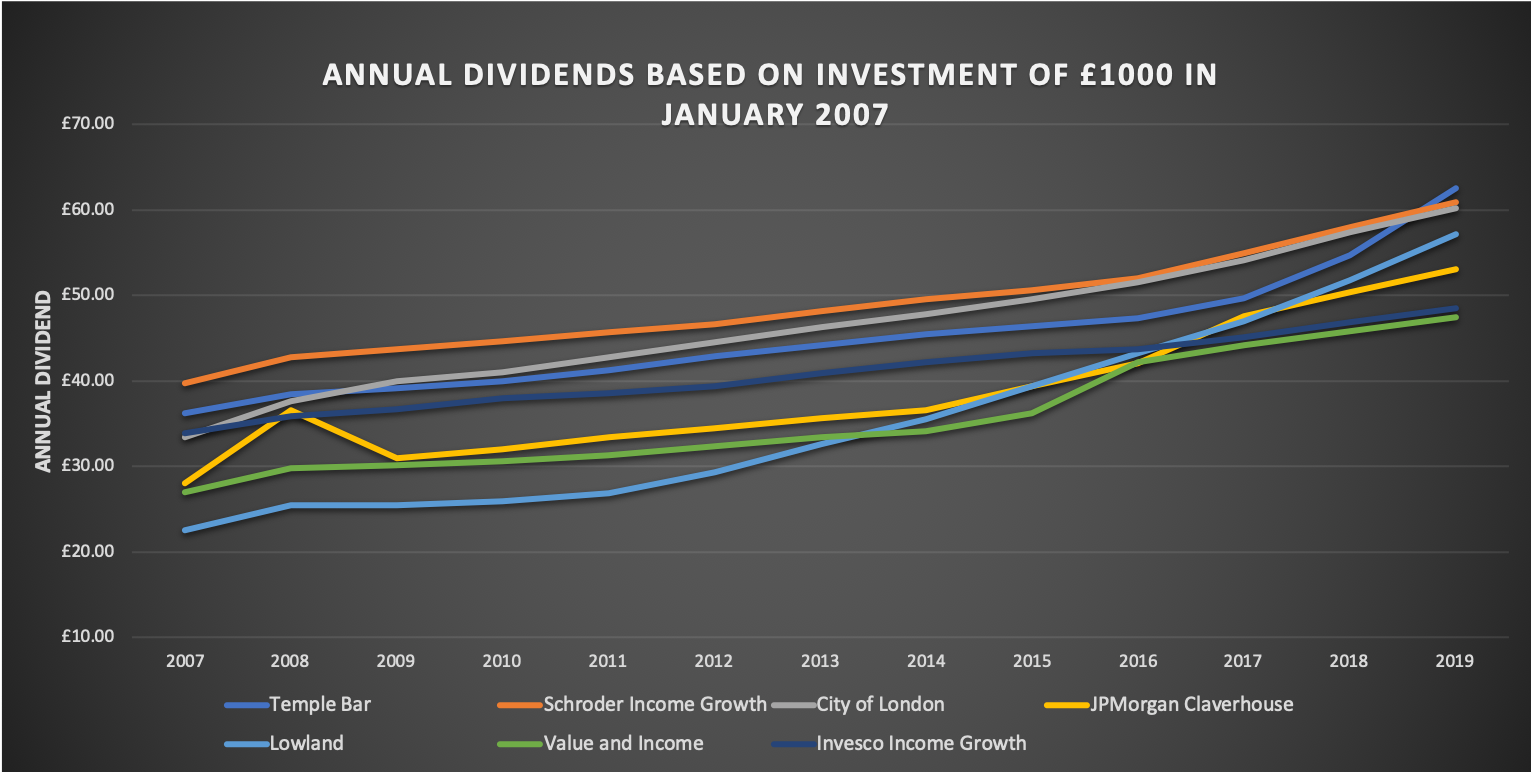 |
Annual Dividends 2007 to 2019 |
The table below shows the total dividends paid, share price gain and total return for an initial investment of £1000:-
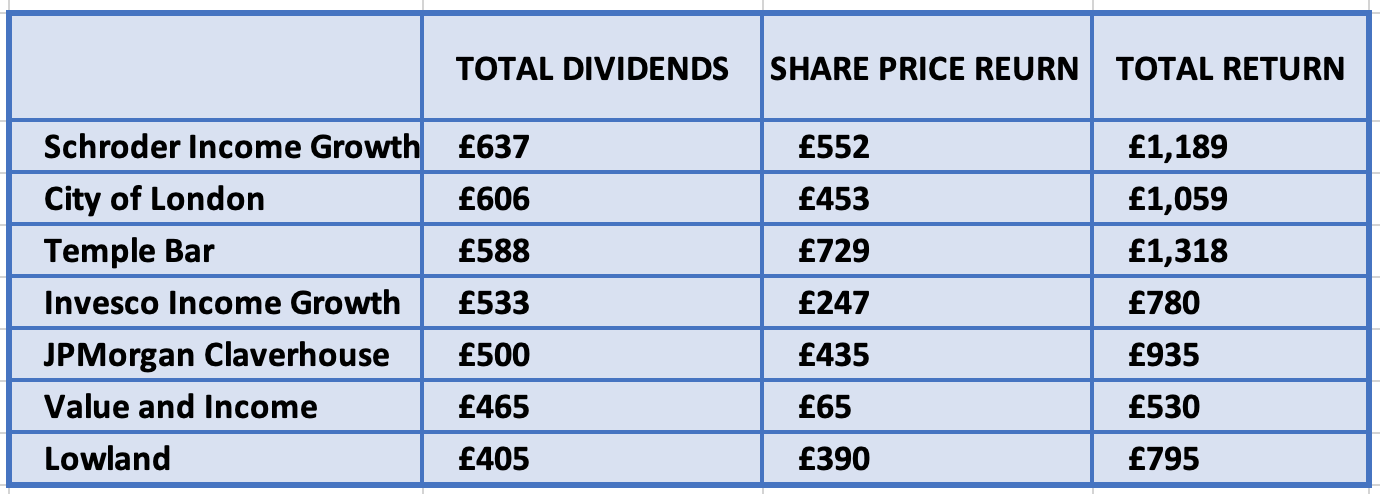 |
Total Dividends Paid, Share Price Gain and Total Return 2007 to 2019 for £1000 Investment |
And The Winners Are!
Schroder Income, City of London and Temple Bar are clear winners generating the highest dividend income, the greatest capital gain over the period 2007 to 2019, reasonable reserves and current yields of at least 4%. Worst performer was Value and Income in penultimate position for dividend income and barely generating any share price gain. It is however somewhat of a hybrid equity/property trust as it has a significant property portfolio and the property sector was severely hit in 2008 with many trusts having to reduce their dividends.
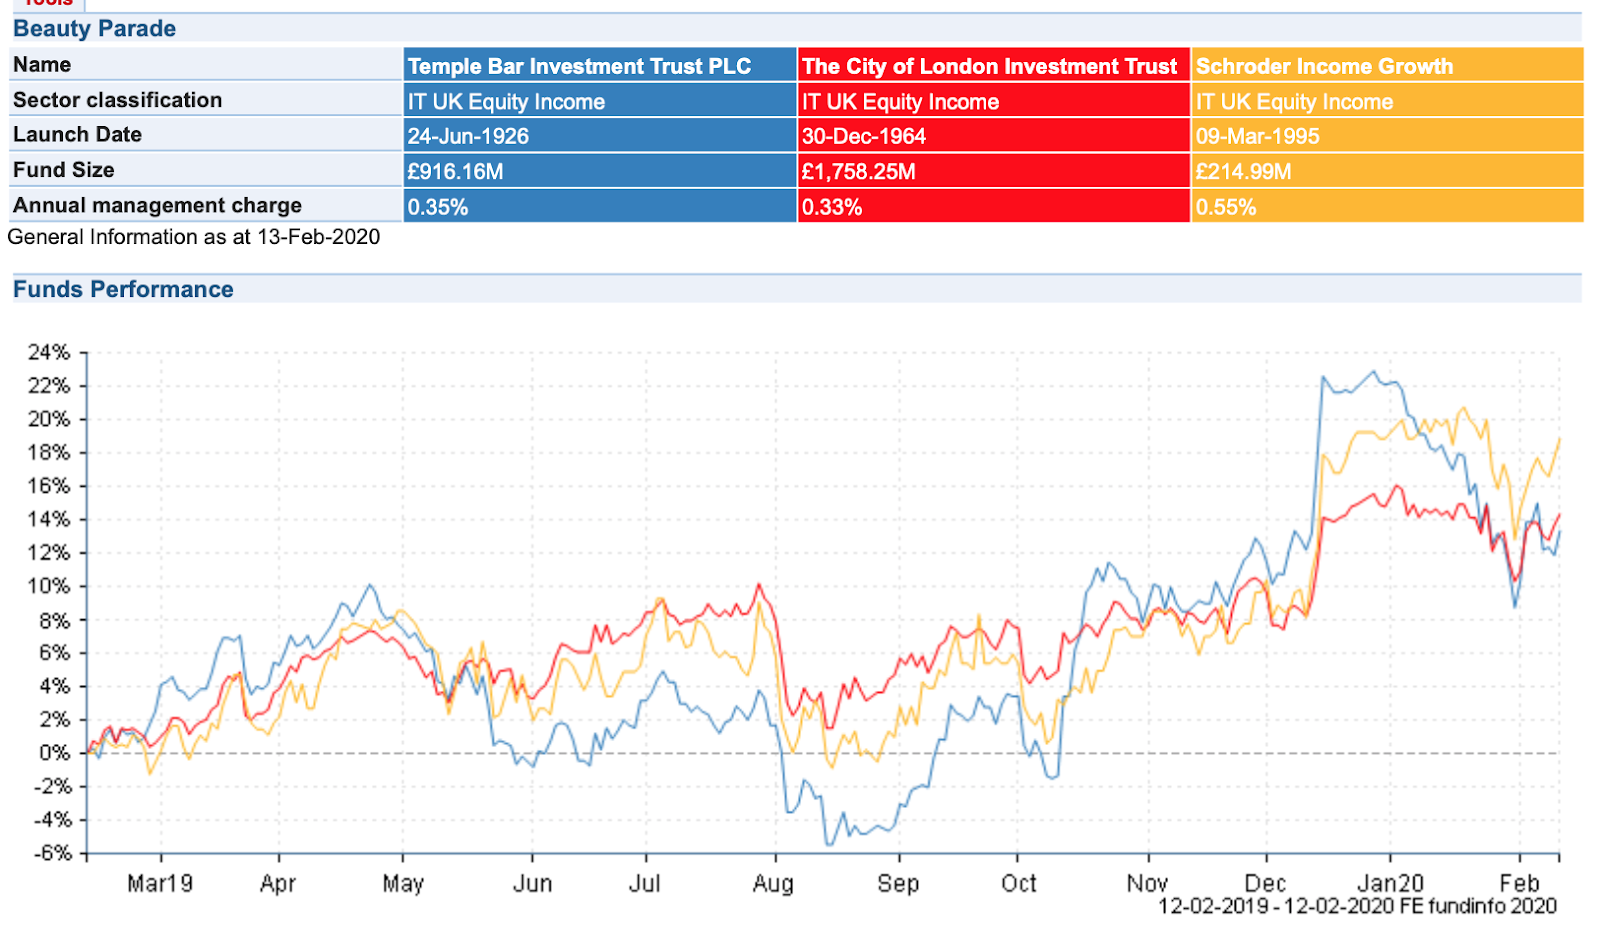 |
12 Months Performance Comparison |
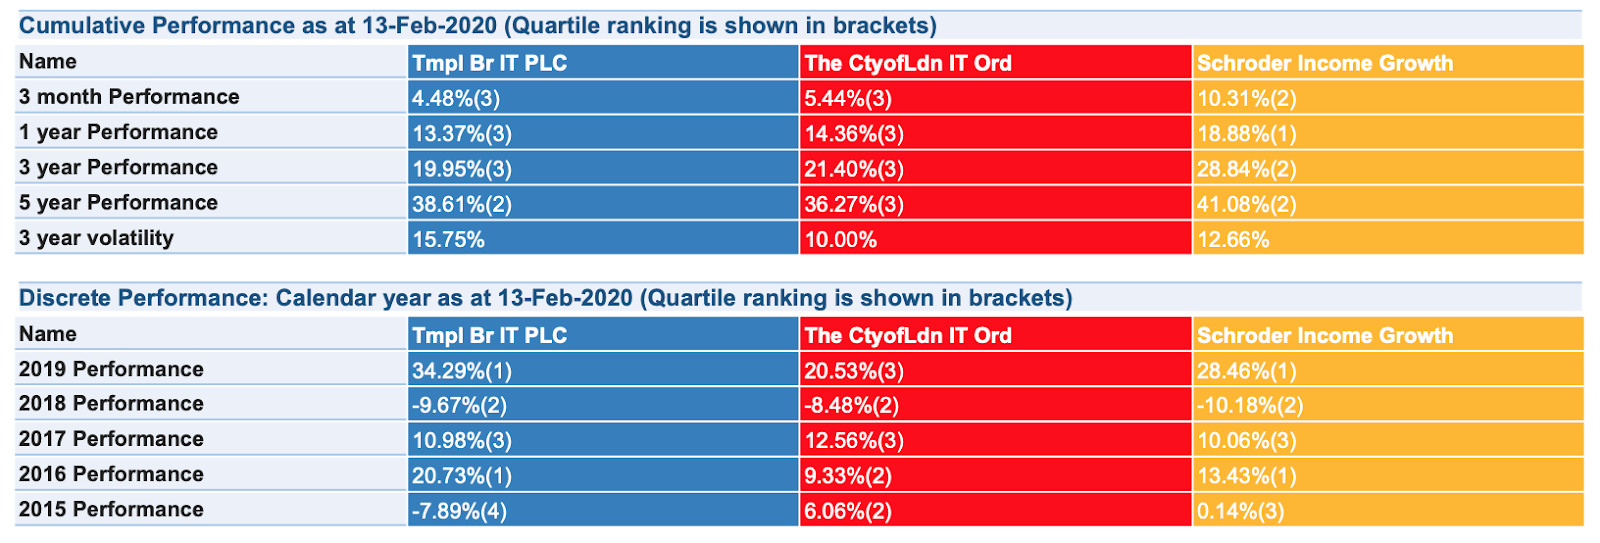 |
Historical Performance |
Runner up out of the remaining trusts is JPMorgan Claverhouse producing average dividends and capital appreciation but with a current yield of 3.7% is a weak buy.
The only negative about the three winners is that they are highly correlated and the preference if one was going to choose three UK income trusts would be to choose three with significantly different portfolio characteristics.
The only negative about the three winners is that they are highly correlated and the preference if one was going to choose three UK income trusts would be to choose three with significantly different portfolio characteristics.
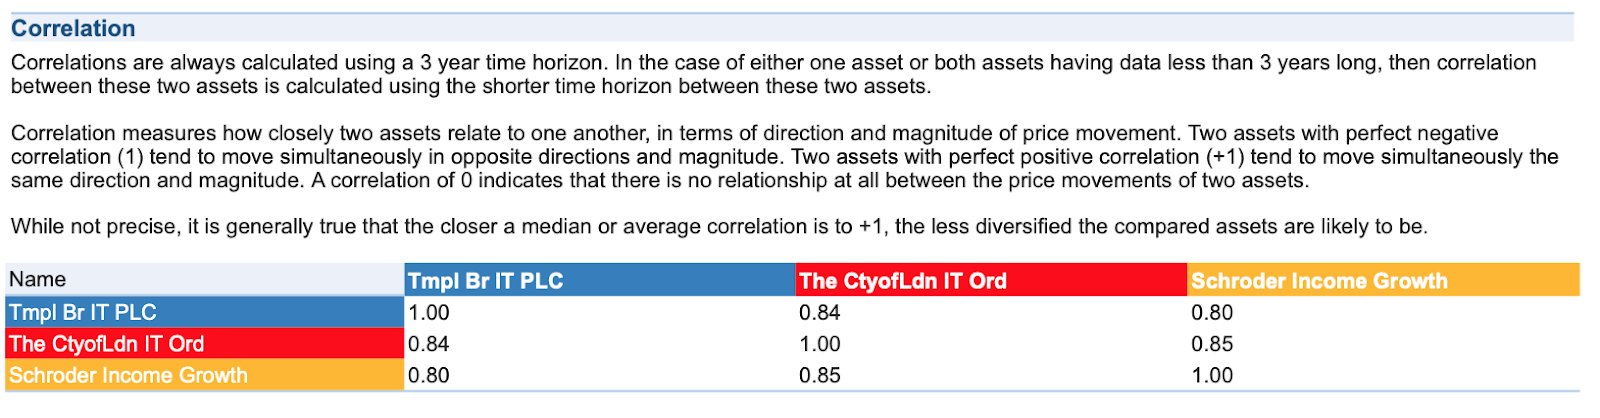 |
Correlation of the Three Winners - Too Close for Comfort |
As is often said "history is no guide to future performance"but we have no better basis from which to assess a potential investment. In the case of an Investment Trust the board of directors have the freedom to appoint alternative managers in the case of poor performance and this does occasionally occur so a Woodford Income event is unlikely to occur. All three winning trusts appear on the AIC Dividend Heroes list of those ITs that have increased their dividends for 20 years or more, with a 52 year record for City of London, 35 years for Temple Bar and 23 years for Schroder. So these three trusts are destined for my SIPP.




0 Comments