Revised Income Trust Income Portfolio
This revised retirement income portfolio has a starting yield of 4.4% is internationally diversified and backtesting proved that its income payouts would have weathered the post 2008 period when dividends were often cut.
I´ve learnt many lessons for the 2008 market crash and the Brexit ups and downs and whilst my investment trust income portfolio performed well (12 year review)it could have done a lot better. So I´ve chopped and changed to optimise my retirement income portfolio but my preference for Investment Trusts remains firm. (see post).
Out go REITS and trusts that pay dividends from capital and in remain or join trusts that maintained or grew dividends post 2008 crash and have good dividend cover.
I´ve learnt many lessons for the 2008 market crash and the Brexit ups and downs and whilst my investment trust income portfolio performed well (12 year review)it could have done a lot better. So I´ve chopped and changed to optimise my retirement income portfolio but my preference for Investment Trusts remains firm. (see post).
Out go REITS and trusts that pay dividends from capital and in remain or join trusts that maintained or grew dividends post 2008 crash and have good dividend cover.
ORIGINAL PORTFOLIO:-
| ANNUAL DIVIDENDS BASED UPON INITIAL INVESTMENT OF £10000 | ||||||||||||
| 2007 | 2008 | 2009 | 2010 | 2011 | 2012 | 2013 | 2014 | 2015 | 2016 | 2017 | 2018 | |
| CITY OF LONDON | £57 | £64 | £68 | £70 | £73 | £76 | £79 | £82 | £85 | £88 | £92 | £98 |
| EDINBURGH IT | £71 | £73 | £74 | £75 | £79 | £82 | £84 | £85 | £87 | £91 | £95 | £95 |
| HENDERSON FAR EAST | £51 | £74 | £76 | £84 | £92 | £98 | £105 | £112 | £118 | £123 | £128 | £133 |
| EUROPEAN ASSETS | £123 | £135 | £63 | £79 | £92 | £75 | £97 | £116 | £112 | £153 | £143 | £119 |
| MURRAY INT | £53 | £62 | £73 | £96 | £110 | £100 | £110 | £103 | £115 | £129 | £130 | £125 |
| PERPETUAL INCOME AND GROWTH | £49 | £53 | £55 | £58 | £65 | £70 | £74 | £77 | £80 | £83 | £130 | £135 |
| F and C UK PROPERTY | £72 | £73 | £77 | £77 | £77 | £77 | £77 | £53 | £53 | £53 | £53 | £53 |
| ANNUAL DIVIDENDS | £475 | £535 | £486 | £538 | £587 | £578 | £625 | £627 | £650 | £720 | £772 | £758 |
| DIVIDEND YIELD | 4.2% | 5.0% | 6.2% | 5.5% | 5.2% | 5.3% | 5.1% | 4.6% | 4.5% | 5.2% | 5.1% | 4.6% |
My original portfolio fared well in the decade following the 2008 crash. Dividends increased 60% over the 10 years which is an annualised rate of 4.8% around inflation +2%. The disappointments were the European Assets Trust and ´F&C´ UK Property. European Assets pay dividends from capital and have a target of 6% of NAV. When the market crashed in 2008 by nearly 50% so did the dividend payout. There are various "income" trusts whose dividends are partly funded from capital rather than from their dividend revenue. These trusts will always have payouts vulnerable to market performance - a lesson learnt and to be avoided in the future. Low dividend coverage is a warning sign and it is always useful to check the annual reports to compare revenue receipts with total dividend payout. If payouts exceed revenue then the trust is either paying from capital receipts or dipping into revenue reserves.
´F&C´ wasn´t the only property trust to suffer post 2008. Property is incorrectly thought of as being uncorrelated with the equity market but history shows they usually crash in tandem and in 2008 all property trusts suffered severely and most cut dividends and few have been able to restore them to their pre-2008 levels. So whilst some have attractive yields of 5% and above their payouts are too vulnerable to market downturns to be part of my retirement portfolio.
With my new portfolio I´ve analysed performance back to pre-crash 2007 looking primarily for trusts that have had been able to maintain or increase dividends post-crash and have had total returns at lease equal to the FTSE All share. Its very easy to get 5 year performance but for me the real test is when the going gets hard which most recently was 2008. With the Brexit currency ups and downs in mind and the under performance of the UK market I´ve also aimed to have greater geographical diversification.
I´ve analysed performance assuming purchases in January 2007. Markets peaked around July 2007 at around 7% higher than January levels and thereafter declined bottoming out around March 2009 some 40% below its highs.
The average yield of the portfolio in January 2007 was 4.3% and had the portfolio been purchased in March 2020 the yield would have been 4.4%.
| NEW RETIREMENT INCOME TRUST PORTFOLIO | ||||
| COMPOUND ANNUALISED TOTAL RETURN 2007-2019 | YIELD MARCH 2020 | 5 YEAR DIVIDEND GROWTH | DIVIDEND COVER YEARS | |
| North American Income | 13.2% | 3.2% | 9.5% | 1.33 |
| Schroder Oriental Income | 9.6% | 4.5% | 5.7% | 1.15 |
| JPMorgan European Income | 6.3% | 4.6% | 7.1% | 1.15 |
| JPMorgan Claverhouse | 5.3% | 4.1% | 7.7% | 1.48 |
| City of London | 5.7% | 4.8% | 4.7% | 0.76 |
| Schroder Income Growth | 5.6% | 4.6% | 4.4% | 1.39 |
| HICL Infrastructure | 6.9% | 4.7% | 2.5% | NA |
| Murray International | 8.2% | 4.9% | 3.7% | 1.07 |
| AVERAGE | 7.6% | 4.4% | 5.7% | |
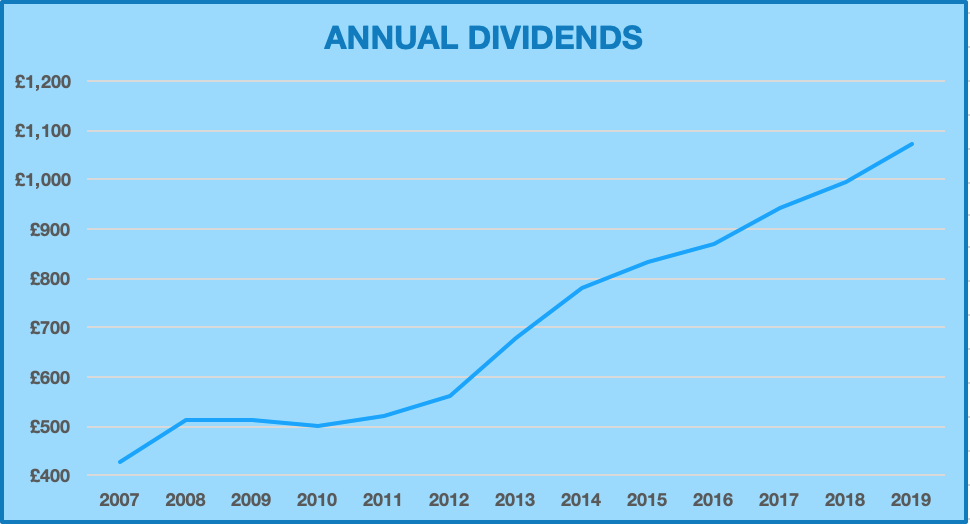
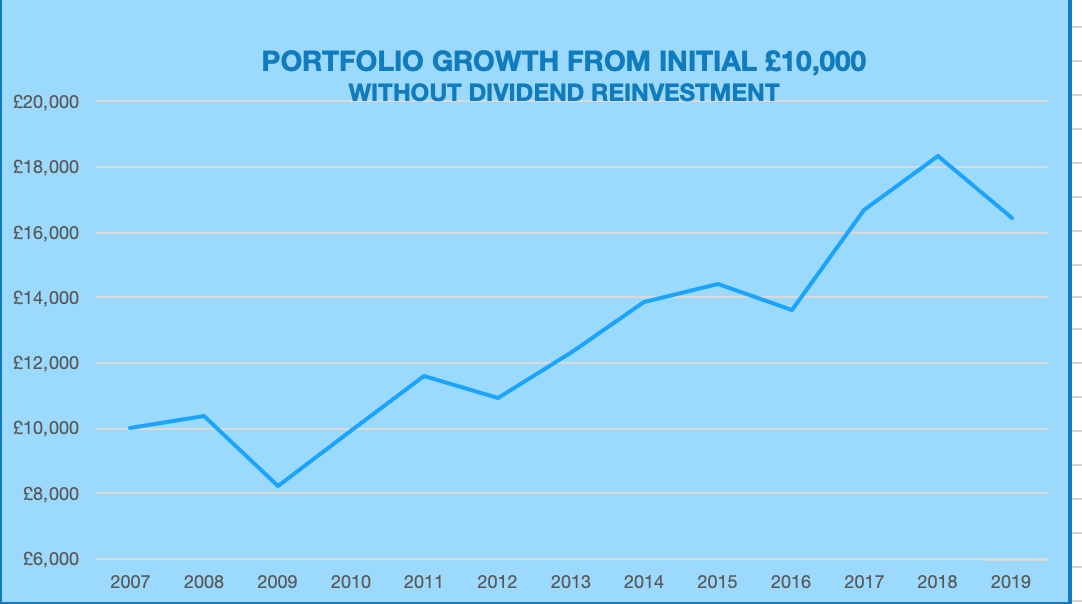
An initial investment of £10,000 would have grown to £16,447 by March 2020 plus a total of £9,216 paid in dividends.
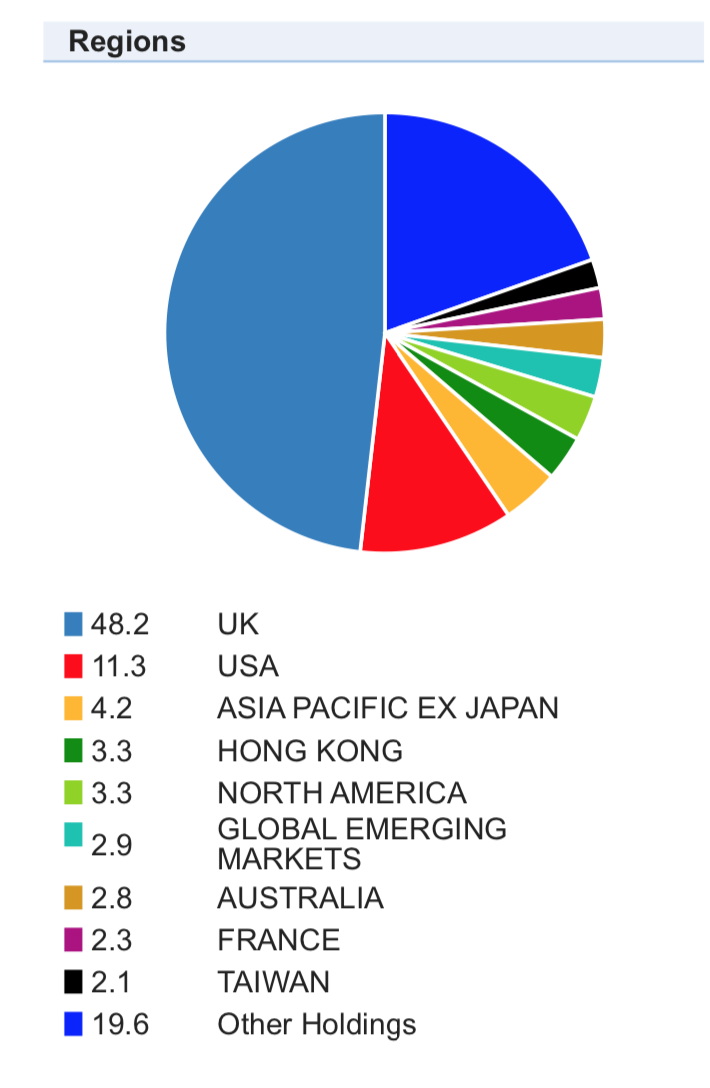
The portfolio is nearly 50% invested in the UK and the remainder diversified globally:-




0 Comments