
In my post Retiring on Dividends I concluded that a living off dividend strategy was only going to be viable for the first few years of my retirement as I am going to need more income than natural yield can provide, sadly I can´t just drink the milk I´m going to have to eat the cow as well! It would be great not to have to touch capital and leave a hefty inheritance and this still may be possible depending upon my longevity and portfolio performance but apologies to my family I´m going to have to be selfish and spend some of your inheritance!
As I discussed in Part 1 of this series about Drawdown Strategy, successful drawdown (not outliving your capital) is complex and has three main elements: Initial Drawdown Rate, Withdrawal Strategy and the Retirement Portfolio. There is a wealth of analysis, discussion and academic research around the subject of portfolio design. It is a subject that lends itself to analysis with almost a century of market data available allowing researchers access to multiple data sets to which statistical tools such as Monte Carlo Simulation may be applied in order to produce a portfolio that has the highest probability of facilitating the highest withdrawal rate whilst not depleting the portfolio to zero before the end of the pensioner´s life. With such a simple objective and everyone sharing the same data and the same tools it is surprising that there is little consensus as to the optimum portfolio evidenced by the dozens of different portfolios publicised by respected financial experts.
The good news for the amateur investor is that there is now a variety of free tools available to help in designing a drawdown portfolio, two of my favourites are Portfolio Visualizer and Portfolio Charts, .. there are several others. The only downside of all of them is that they are USA centric so whilst excellent for comparing asset allocations, real numbers such as Safe Withdrawal Rates are likely to be optimistic for a UK investor. The range of investments available to the US investor is also much greater and fees lower and it can be frustrating to identify an asset class such as Small Cap Value which one would like to incorporate into a portfolio only to find that your UK broker cannot trade in it. My intention in writing these posts is to clarify my thoughts using the best research available in order to devise the optimum retirement income strategy for me.
Portfolio Difference Between Accumulation and Drawdown
I´m sure many financial advisors would disagree but the accumulation phase is easy - 100% equities for 20 to 30 years then a progressive increase in bond holdings. If you want to make life really easy just go for a product like Vanguard´s Target Retirement Funds where all you have to do is select your retirement year and Vanguard will gradually increase your bond allocation as you grow older.
Drawdown Portfolios are different because the portfolio must find the sweet spot between volatility and growth. On one extreme a portfolio 100% in cash or bonds will have low volatility but such low growth that maybe the Safe Withdrawal Rate (SWR) would only be around 1.5% so an income of only £1500p.a. form a £100k portfolio. On the other extreme is a 100% stock portfolio that provides a 4%+ SWR but with heart attack provoking crashes of up to 70% in portfolio value combined with the worry of Sequence of Return Risk when you get hit by years of market downturn in the early years of retirement and have to sell off your investments at rock bottom prices. One of the proponents of a near 100% stock allocation is Warren Buffett. He has recommended a 90% stock 10% cash or equivalent to his heirs which makes complete sense when 10% cash probably represents a lifetimes income for most of us.
The 60/40 stock/bond portfolio has been the mainstay of retirement investment for decades but since the crash of 2008 and the decade or so of low bond yields it has been widely questioned (see Forbes article) but is is interesting to compare it with some of the popularised alternatives.
Below is an analysis of 13 of of the more common portfolio. The asset allocation of each can be seen here. The analysis was undertaken using the US Portfolio Analyser Monte Carlo Simulation tool assuming an initial portfolio value of $1,000,000 and a drawdown rate of 4%, for a 30 year retirement with annual adjustment for inflation. The simulation uses a historic range of data depending upon the asset classes within the portfolio and the available historic data for that asset. The simulation creates 10,000 30 year variants of the data set so not only is it taking actual historic 30 year periods it is jumbling the data to create fictional scenarios some of which are likely to me worse return sequences than historically encountered.
The table shows:_
Survival Rate: the percentage of scenarios that did not run out of money before the end of the 30 year retirement period.
10th Percentile SWR: the minimum safe withdrawal rate (SWR) for 90% of the 10,000 30 year sample periods
10th percentile End Balance: 90% of scenarios would end with a greater portfolio value that this at the end of 30 years.
50th Percentile SWR: the minimum safe withdrawal rate (SWR) for 50% of the 10,000 30 year sample periods
50th percentile End Balance: 50% of scenarios would end with a greater portfolio value that this at the end of 30 years.
CAGR. Compound Average Portfolio Growth Rate
Standard Deviation: This is the standard deviation of the CAGR. A CAGR of 5% with a 10% standard deviation indicates that for the 10,000 sample periods the CAGR varied 5% +/- 10% (4.5% to 5.5%) for 68% of the samples. The higher the standard deviation the more volatile the portfolio.
| PORTFOLIO COMPARISON 30 YEARS 4% INITIAL DRAWDOWN | |||||||
| Portfolio | Survival Rate | 10th Percentile SWR | 10th Percentile End Balance | 50th Percentile SWR | 50th Percentile End Balance | CAGR | STANDARD DEVIATION |
| Golden Butterfly | 99.87% | 5.7% | $3,168,077 | 7.4% | $7,895,368 | 8.22% | 9.96% |
| 40/60 | 99.43% | 5.2% | $1,458,775 | 6.7% | $3,987,990 | 8.00% | 6.54% |
| 60/40 | 98.08% | 5.1% | $1,512,356 | 7.3% | $5,896,421 | 8.91% | 7.00% |
| Ray Dalio All Weather | 99.49% | 5.0% | $965,745 | 6.3% | $2,575,918 | 6.72% | 6.78% |
| Bill Schultheis Coffeee House | 97.71% | 5.0% | $1,039,500 | 7.0% | $4,317,251 | 7.98% | 8.90% |
| Harry Browne Permanent Portfolio | 98.83% | 4.9% | $1,281,157 | 6.2% | $3,794,001 | 8.27% | 7.11% |
| Bill Bernstein No Brainer | 94.30% | 4.5% | $616,580 | 7.1% | $5,230,852 | 8.61% | 11.54% |
| David Swensen Yale Endowment | 94.59% | 4.5% | $529,013 | 7.0% | $4,199,807 | 7.85% | 10.61% |
| Scott Burns Couch Potato | 93.42% | 4.3% | $239,709 | 6.1% | $2,293,393 | 6.57% | 7.77% |
| Rick Ferri Core Four | 92.28% | 4.3% | $255,764 | 7.1% | $4,658,268 | 8.15% | 11.43% |
| Bogleheads Three Funds | 92.30% | 4.2% | $273,239 | 7.0% | $4,878,302 | 8.48% | 11.80% |
| Larry Swedroe Simple Portfolio | 92.21% | 4.2% | $214,446 | 6.4% | $2,983,718 | 7.11% | 10.03% |
| David Swensen Lazy Portfolio | 90.34% | 4.0% | $23,411 | 6.5% | $3,050,160 | 7.17% | 10.68% |
| Bogleheads Four Funds | 80.52% | 3.3% | $0 | 5.9% | $2,017,008 | 6.44% | 11.96% |
The Golden Butterfly if a clear winner with the highest SWRs for both the 10th and 50th deciles. End balances are nearly double its nearest rival the 40/60 portfolio and 50% of retirees would have end balances in excess of $7.8m. Whilst the Standard Deviation of the Golden Butterfly is greater than its nearest rivals it has the lowest drawdown (the maximum decline in portfolio value) of the top 6 portfolios. For an investor wary of investing in gold and long term bonds and is looking for simplicity the traditional 2 fund equity/bond portfolios are still good options even if they are not the optimum choice.
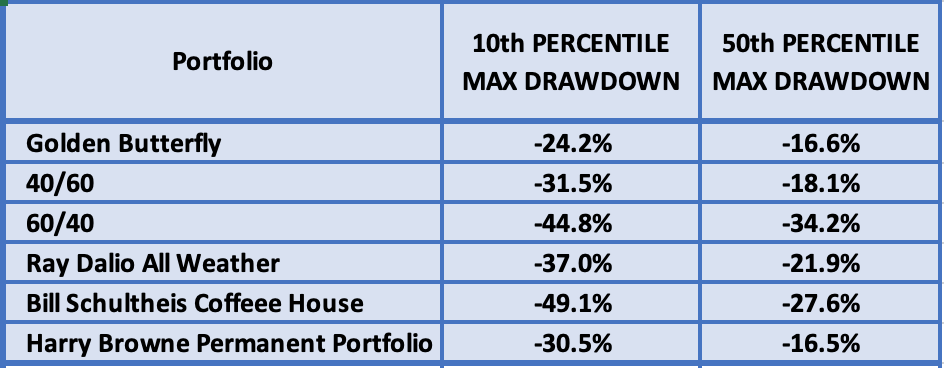 |
MAXIMUM PORTFOLIO DRAWDOWN |
Validation with Portfolio Charts
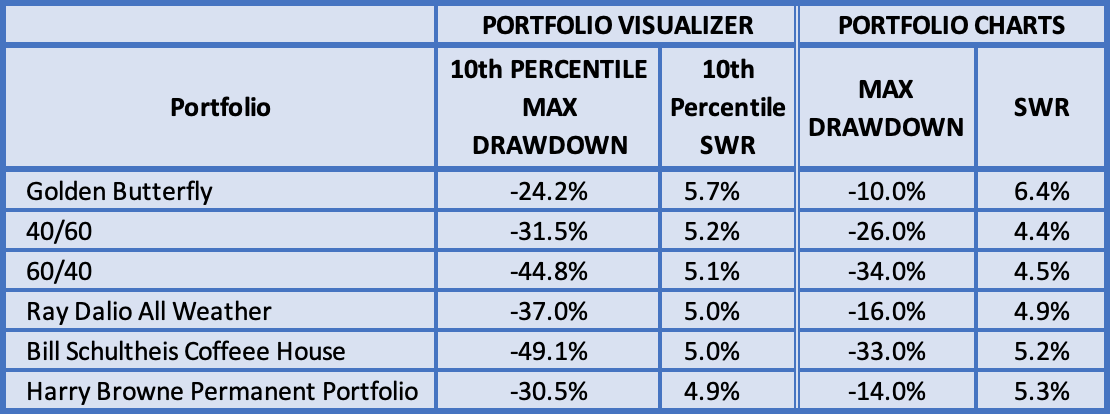 |
COMPARISON OF RESULTS FROM PORTFOLIO VISUALIZER AND PORTFOLIO CHARTS |
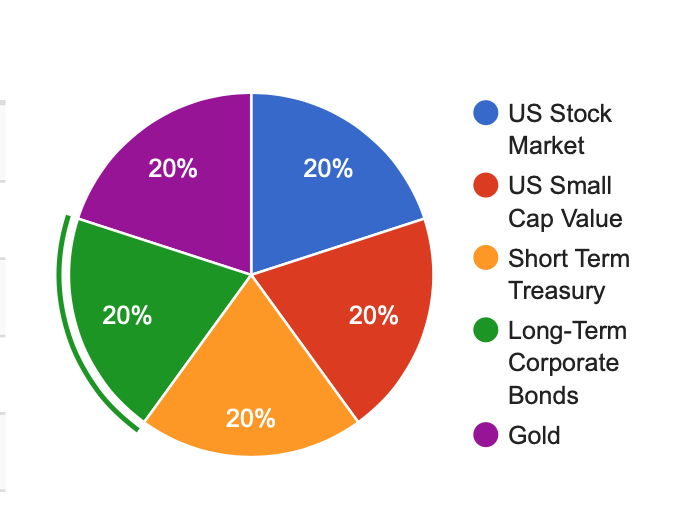
The Golden Butterfly Portfolio
The Golden Butterfly originated from Tyler’s Portfolio Charts and is often considered as a derivative of Harry Browne´s Permanent Portfolio which I looked at in a previous post. Like the permanent Portfolio is comprises of 4 asset types:-
- Equities
- Short term government bonds bonds
- Long term government bonds
- Gold
 |
THE GOLDEN BUTTERFLY |
Whereas the Permanent Portfolio has equal weightings of each asset, the Golden Butterfly aims for higher growth by allocating 40% to equities split evenly between Total Market and Small Cap Value and equal allocations to short term government bonds, long term government bonds and gold.
As with the Permanent Portfolio the idea is to have four asset classes to deal with all likely market conditions - equities provide growth in expansionary markets, gold in inflationary markets, long term bonds during deflationary periods bonds and short term government bonds/cash provide protection during market crashes.
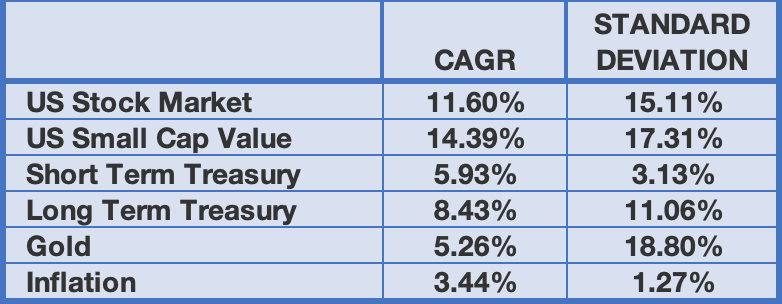 |
ASSET CLASS PERFORMANCE |
The Golden Butterfly provides more growth potential by allocating 40% to equities rather than 25% and an allocation of 50% of the equities to Small Cap Value (see Paul Merriman for more information about Small Cap Value). The higher equity allocation results in higher volatility than The Permanent Portfolio but an average growth rate more than 2.5 percentage points higher.
Many people will be wary of this portfolio. Gold is not a well liked asset class and many investors will be wary of investing in long term bonds with interest rates at historic lows. A further problem is that there are only around 50 years of data available on some of the asset classes so we have no knowledge of how the portfolio would have performed during the late 60s and early 70s when there were 2 market crashes close to one another. However, the out performance of this portfolio and the rational behind the asset allocation makes it a very attractive option for me and is the portfolio I will use for drawdown.
Choosing the Investment
UK or Overseas?
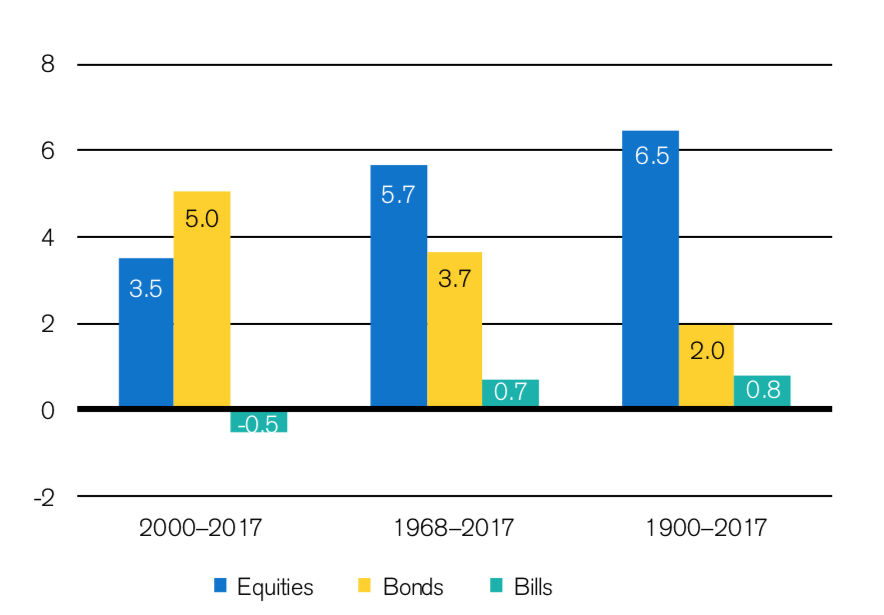 |
US REAL RETURNS FROM ASSET CLASSES |
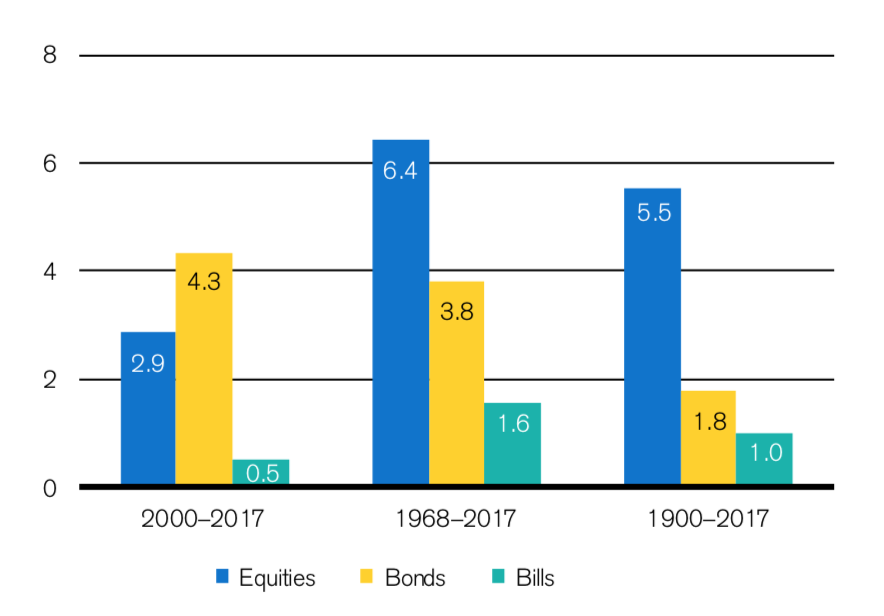 |
UK REAL RETURNS FROM ASSET CLASSES |
So the US outperformed 2000-2017, underperformed 1969-2017 and outperformed 1900-2017. A confusing picture! So overseas diversification is no guarantee of higher returns - you may be lucky ..or not.
Another factor that should favour overseas diversification is the long term decline in the value of sterling. An exchange rate of $2.4/£ doesn´t seem so long ago and I´m sure many people still remember $4/£. However, a surprising fact emerges when one examines the real dollar pound exchange rate (Daily Telegraph - 200 year relationship) taking into consideration differential inflation rates. This shows that whilst the nominal value of the pounds has devalued significantly from high points of around $4 to the pound in 1940 to 1.30 today it has in fact in real purchasing value terms stayed remarkably constant.
Implementation of the Golden Butterfly
The US based investor has a wide range of ETFs and funds from which to choose and at lower costs than in the UK. For instance four of the 5 assets classes of the Golden Butterfly can be sourced from Vanguard USA ETFs:-
- BLV Long Term Treasury. Expenses ratio 0.07%
- VGSH Short Term Treasure. Expense ratio 0.05%
- VTI Total Stock Market. Expense ratio 0.03%
- VBR Small Cap Value. Expense Ratio 0.07%
- Vanguard do not have a Gold ETF but the world´s largest physical gold ETF is SPDR GLD with a 0.4% expense ratio.
Portfolio for a UK Investor
Where possible I have selected index ETFs or funds. Harry Browne creator of the Permanent Portfolio proposed direct holding of gold bullion and the purchase of individual government securities rather that funds or ETFs in order to reduce risk third party risks. Something that some investors might like to consider - but I´m all for a simple life so I´ll keep my fingers crossed that BlackRock or Vanguard aren´t just giant Ponzi schemes.
I´m only considering sterling gilts for the fixed interest portion of the portfolio. There is an argument for international bond diversification but this would be a complication too great for me and sticking with sterling fixed interest counterbalances the overseas currency components of the portfolio.
Cash/short term gilts
If the portfolio is kept within a SIPP or ISA there is little alternative but to keep the liquid element of the portfolio in short term gilts and most conveniently via an ETF such as Ishares Gilts 0-5yr or
Invesco Gilts 1-5yr. If the portfolio is outside of an ISA or SIPP there are far better options available through a combination of easy access and term accounts should allow double the 0.7% or gilt yield with the additional advantage of zero trading costs.
Long Term Gilts
The choice is between an ETF, SPDR Bloomberg Barclays 15+ Year Gilt or the
EQUITY TOTAL MARKET
UK: Trackers of the FTSE All Share offer historically higher returns than the FTSE100 and greater diversification. There are various options in ETFs and funds including:-
- SPDR FTSE All Share,
- Xtrackers FTSE All Share
- Lyxor Core Morningstar UK
- Vanguard FTSE UK All Share (fund),
- Fidelity Index UK Fund,
- HSBC FTSE All Share Index (fund)
| 1 year | 3 year | 5 year | 10 year | OCF | NO OF STOCKS | NORTH AMERICA | UK | ||
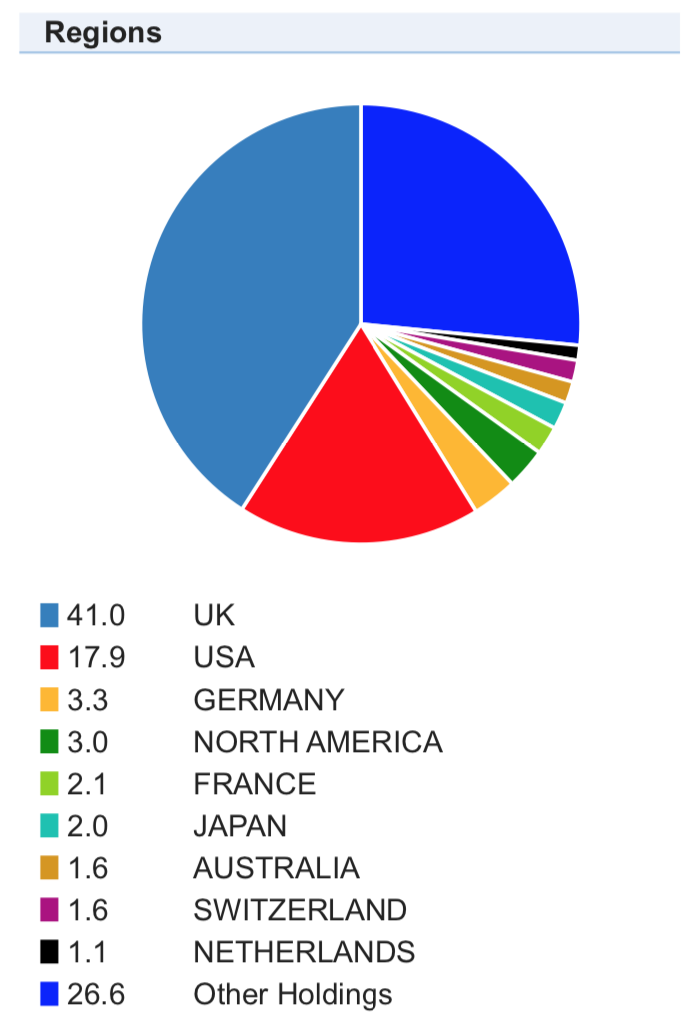
| FUND | Vanguard FTSE Developed World ex-U.K | 17.6% | 33.3% | 80.0% | 221.3% | 0.14% | 2081 | 68.4% | 0.0% |
| FUND | Vanguard FTSE Global All Cap Index Fund | 15.1% | 29.0% | 72.5% | 200.6% | 0.23% | 6495 | 58.9% | 5.0% |
| FUND | Vanguard SRI Global Stock Fund | 17.1% | 31.7% | 71.7% | 207.9% | 0.22% | 1810 | 64.4% | 5.4% |
| ETF | iShares Core MSCI World UCITS ETF | 20.6% | 34.9% | 80.9% | NA | 0.20% | 1640 | 64.4% | 5.1% |
Small Cap
UK Small Cap
Ishares offer a UK Small Cap ETF (CUKS) which has provided excellent performance compared with the FTSE All Share:-
|
5 Year Annualised
|
10 Year Annualised
|
|
|
FTSE All Share
|
5.98%
|
8.85%
|
|
Ishares UK Small Cap
|
8.81%
|
12.46%
|
Overseas Small Cap
|
|
5 YEAR ANNUALISED RETURN
|
10 YEAR ANNUALISED RETURN
|
|
|
UK
|
||
|
BlackRock Throgmorton Trust
|
22.69%
|
21.79%
|
|
Standard Life UK Smaller Companies
|
19.20%
|
19.63%
|
|
Invesco Perpetual UK Smaller Companies
|
18.59%
|
19.34%
|
|
JPMorgan Smaller Companies
|
18.52%
|
18.57%
|
|
OVERSEAS
|
||
|
Edinburgh Worldwide
|
21.09%
|
17.32%
|
|
Herald
|
17.22%
|
15.98%
|
|
North Atlantic Smaller Companies
|
12.76%
|
15.62%
|
|
BMO Global Smaller Companies
|
10.07%
|
14.80%
|
I had hoped it would be possible to select index funds for the small cap part of the portfolio it is impossible to ignore the performance differences compared with ITs.
My Golden Butterfly Portfolio
|
GOLDEN BUTTERFLY PORTFOLIO
|
||
|
ASSET
|
%
|
|
|
CASH
|
20%
|
Ishares Gilts 0-5yr
|
|
TOTAL STOCK MARKET
|
20%
|
iShares Core MSCI World ETF
|
|
SMALL CAP UK
|
10%
|
BlackRock Throgmorton IT
Standard Life UK Smaller Companies
|
|
SMALL CAP GLOBAL
|
10%
|
Edinburgh Worldwide IT
Smithson IT
|
|
LONG TERM GILTS
|
20%
|
Vanguard Long Duration UK Gilt Fund
|
|
GOLD
|
20%
|
iShares Physical Gold ETF
|
|
Manager
|
Unit Name
|
% of Portfolio
|
1 Year Perf.
|
|
iShares
|
20.0
|
-1.5
|
|
|
Vanguard Investments UK
|
20.0
|
28.8
|
|
|
iShares
|
20.0
|
1.8 | |
|
iShares
|
20.0
|
27.8
|
|
|
Fundsmith
|
5.0
|
6.4
|
|
|
Baillie Gifford & Co Ltd
|
5.0
|
1.2
|
|
|
Standard Life Investments
|
5.0
|
14.3
|
|
|
BlackRock Investment Management
|
5.0
|
12.3
|
|
|
Total Portfolio
|
Total Portfolio
|
100.0
|
12.7
|
|
Selected Benchmark
|
FTSE All Share
|
-10.7
|
|
Manager
|
Unit Name
|
% of Portfolio
|
5 Year Perf.
|
|
iShares
|
20.0
|
48.5
|
|
|
Vanguard Investments UK
|
20.0
|
62.9
|
|
|
iShares
|
iShares UK
|
20.0
|
5.2
|
|
iShares
|
20.0
|
63.6
|
|
|
Baillie Gifford & Co Ltd
|
10.0
|
105.6
|
|
|
Standard Life Investments
|
5.0
|
89.6
|
|
|
BlackRock Investment Management
|
5.0
|
110.8
|
|
|
Total Portfolio
|
Total Portfolio
|
100.0
|
50.9
|
|
Selected Benchmark
|
FTSE All Share
|
11.6
|
The portfolio has higher growth and lower volatility than the FTSE All Share:-
|
Performance Analysis
|
Growth Rate %
|
Volatility
|
Alpha
|
Beta
|
Sharpe
|
Info Ratio %
|
|
Portfolio
|
8.8
|
6.5
|
7.4
|
0.4
|
0.8
|
0.6
|
|
Benchmark - FTSE All Share
|
3.6
|
10.7
|
0.0
|
1.0
|
0.0
|
0.0
|
International Diversification
Monte Carlo Simulation
A 5 year performance history is a good indicator of relative performance but only tells a small part of the story. A Monte Carlo simulation is more useful as it analyses a portfolio of similar asset classes over a large number of historical and simulated scenarios. I have used the Timeline simulation tool to compare the Golden Butterfly with a conventional 60/40 and permanent Portfolio. An exact replication wasn´t possible as Timeline do not have long term gilt or intermediate gilt asset classes, their nearest approximation being UK Aggregate Bonds.
|
ASSETS
|
60/40
|
PERMANENT PORTFOLIO
|
GOLDEN BUTTERFLY
|
|
Cash
|
25%
|
20%
|
|
|
UK Aggregate bonds
|
40%
|
25%
|
20%
|
|
UK Equities
|
60%
|
25%
|
|
|
UK Small Cap
|
10%
|
||
|
Global Equities
|
20%
|
||
|
Global Small cap
|
10%
|
||
|
Gold
|
25%
|
20%
|
|
OUTCOMES
|
60/40
EQUITY/BOND
|
PERMANENT PORTFOLIO
|
GOLDEN BUTTERFLY
|
|
Success Rate
|
88%
|
83%
|
98%
|
|
Longevity
|
93 years
|
92 years
|
95 years
|
|
Legacy
|
£0
|
£0
|
£278.2k
|
|
Lifetime Income
|
£1.13m
|
£1.12m
|
£1.2m
|
- Max. Drawdown: Maximum decline in value
- Recovery Time. How long to recover from a downturn
- Average Return: Average Inflation Adjusted Return
- Safe Withdrawal Rate: The initial withdrawal rate that ensures not running out of money during a 30 year retirement with annual withdrawals increasing by the rate of inflation
- Perpetual Withdrawal rate: The initial withdrawal rate that ensures never running out of money with annual withdrawals increasing by the rate of inflation
|
PORTFOLIO CHARTS COMPARISON
|
|||||
|
Max. Drawdown
|
Recovery Time
|
Average Return
|
Safe Withdrawal Rate
|
Perpetual Withdrawal Rate
|
|
|
60/40 Equity/Bond
|
57%
|
12yrs
|
6.1%
|
4.0%
|
3.2%
|
|
Permanent Portfolio
|
9%
|
5yrs
|
4.7%
|
5.3%
|
3.7%
|
|
Golden Butterfly
|
22%
|
5yr
|
5.3%
|
5.7%
|
4.3%
|
Conclusion
Using both historical data and Monte Carlo Simulation the Golden Butterfly is the top performing portfolio for retirement drawdown. There are some caveats: some historical data is limited, some investment products have been in existence less than a decade and whilst is is relatively easy to simulate a US portfolio, the UK investor can only approximate to the ideal Golden Butterfly due to the absence of a UK Small Cap value class and of course finally - the past is no accurate predictor of the future.
I certainly intend to go ahead and implement a Golden Butterfly portfolio. I already operate a Permanent Portfolio and just by adding my proposed 4 small cap Investment Trusts I can morph the permanent Portfolio into a Golden Butterfly with just the minor issue of timing with the current market volatility and threat of a prolonged bear market.


You clearly have been very busy.
There is some great info in this article. Thanks for sharing.
Have you read the following big ERN post:
https://earlyretirementnow.com/2020/01/08/gold-hedge-against-sequence-risk-swr-series-part-34/
In this post he attributes a lot of the GB performance to the contribution from small-cap-value stocks. If you cannot actually access this class then this may compromise your achievable performance. Just a thought.
And 40/60 or 60/40 is just so much easier to implement, and they may be cheaper (definitely in terms of your time) too!
Many thanks for your comments. Yes I recently read Big Ern´s post but missed his comment about UK small cap value. Prior to reading the post I had already set up a Permanent Portfolio with 25% gold so I was focussed on his comments on this but remember well that he concluded that gold could play a valuable role in a portfolio - but it wasn´t for him! I guess he has a great data source but I haven´t been able to find a suitable ETF or index fund to access UK small cap value hence my use of general small cap in the Golden Butterfly portfolio which based on US figures will underperform small cap value by 1.5% or so but outperform total market.
I assumed there were no suitable UK products available due to the small number of companies that would be eligible for consideration. The Vanguard US small cap value ETF has over 850 companies with average capitalisations of $3.8 billion - which seems far from small cap to me. and maybe a UK equivalent would just comprise of AIM companies - too risky for me!
I agree with your comments about 60/40 and 40/60. I was surprised by how well they performed and in a way I was disappointed by just how well the Golden Butterfly performed as I would love to simplify life by having a 2 fund portfolio or better still one fund using Lifestrategy or similar. My worry is not so much the time involved in managing the portfolio but the concern that in a few years time I may not have the mental capacity. Maybe an important criteria in choosing an investment strategy for retirement has to be ease of management not solely its income potential. When the current crisis is over I´ll take another look at all the portfolios to see how they stood up to the coronavirus turbulence.
I used the abbreviation GB to mean Golden Butterfly rather than Great Britain - apologies for any unintended confusion this caused.
Hello,
Really interesting article and comparison study.
i'm looking to rationalise my own drawdown (not yet started but imminent) into ETFs/ITs on Fidelity platform , away from existing roughly 60/40 mix of active / passive open ended funds….but always put off …rather nervous of …the high 20% allocation to physical gold.
Particularly if selling existing funds now and therefore (ie in February 2021) such a significant % of gold. Other than that the Butterfly makes sense to me.
Perhaps you'd comment more on the 20% gold allocation ?
Also can i ask if your own Butterfly is a real rather than notional folio , and whether you're in drawdown.
Mix of ETFs and Investment Trusts is attractive fees wise on fidelity on amount c. £220k
Thanks, John C.
Many thanks for your comments John. A 60/40 asset allocation is a good approach near or in retirement. Most evidence indicates that a UK retiree needs a higher equity holding than a US investor so 50-60% in equities is my objective.
Until a couple of weeks ago I operated a real Golden Butterfly portfolio but with small cap Investment Trusts in place of Small Cap Value and fairly recently substituted index linked gilts for cash (you´ll find a posting about my preference for these in place of cash. Yes I am retired and my investments are split between 20% IT income portfolio, 80% drawdown portfolio. Having sold properties over the last 2 years I am retaining cash so I can let the drawdown portfolio grow and only spend the dividends over the next couple of years.
A few weeks back I had cash to invest after a property sale so had to make decisions about asset allocation. I have taxable investments spread across 3 brokers and although I would love to rationalise brokers and holdings, CGT considerations mean it is slow progress and some of my individual holding are not my ideal but I can only sell a little each year. Like you, I have reservations about 20% gold - it worked very well in 2020, as did long duration gilts but I have finally settled on a target asset allocation of 40% total global stock market (un-hedged), 15% high growth, high volatility Investment Trusts (Edinburgh Worldwide, Scottish Mortgage, Throgmorton, Smithson, Std Life Smaller),15% Gold ETF, 15% Long Gilt ETF, 15% Index Linked Gilt ETF. This gives a reasonable balance between growth and volatility. I looked at reducing gold to 10% but this didn´t seem to be sufficient to have a significant impact on reducing portfolio volatility - hence 15%.
Good luck with your investing! Max.
Golden Butterfly's …
Since 1927 (for UK investor) https://i.postimg.cc/GpH5CYsJ/since-1927.png
For a Japanese investor since 1972 https://i.postimg.cc/MT1t6YZR/Japan.png
For a US investor since 1972 https://tinyurl.com/yebjc284
A nice feature is that much of overall actual rewards are subject to valuations at the start and end dates. Early years sequence of returns risk is a significant risk, as is concentration risk. The Golden Butterfly assets pretty much neutralises such risks.
Some wouldn't buy long dated gilts/treasury at such low current yields, however long dated gilts lost much less than many might otherwise believe during the mid 1940's to late 1950's years when inflation spiked up to 12% levels from low 0.5% interest rate type levels. Long dated gilt yields reflect what the bond market predict for the economy/interest rates/inflation for decades out and high inflation can be seen as just being a temporary issue, such that long dated bond yields can remain down at relatively low levels despite high current inflation levels and in so doing tend to see relatively low levels of downside price volatility across such times. Many have been saying to avoid long dated treasury since the 2009 financial crisis/low yields, however they've gained more than 100% since then.
Gold is another often mistaken asset. Both a global currency and a commodity. When traded - such as via periodic portfolio rebalancing, it can yield 'dividends'. Across the 1980's/1990's whilst the price of gold halved, portfolio rebalancing would have seen multiple more ounces of gold being accumulated. 50/50 stock/gold rebalanced for instance would have had around 10 times as many ounces of gold being held. Sooner or later that pays back i.e. acts as a portfolio insurance such as when a decade or more of stock total returns may have lagged inflation, maybe even halved in inflation adjusted terms gold will tend to have doubled or more. 66/33 stock/gold with 66 stock value halving, 33 gold value doubling and … break-even (and twice as much value as a all-stock investor).
Re: Losing ones marbles. With the Golden Butterfly assets it doesn't really matter if you rebalance or not. The initial weightings primarily remove early years sequence of returns risk. Non rebalanced will just tend to see the weighting in the best performing assets rise over time - drifts away from 'target' weightings into something that no longer might resemble a GB but where increased risk is offset by the addition of 'other peoples money' (gains). More weight into the best performing asset, which more often will be stocks, but can also be gold. Simply drawing spending out of the best performer(s) will have the tendency to 'rebalance' at least partially.
Buy a 25 year gilt, hold until 15 years remaining before rotating into another 25 year gilt, or if you're mentally incapable to remember that, no matter, in 15 years time it will mature into cash. Gilt capital gains are exempt from capital gains tax, as are legal tender gold coins. Buy accumulation US and UK FT250 (which is small cap in US scale) index funds. Leave cash in a deposit account to accumulate interest. And when income is required just look at the values of each and draw from the one that has the highest value. Or if just left as-is for 20 whatever years will be a nice portfolio/value even if it nowhere near resembles that of a Golden Butterfly.
Some really interesting comments Seajay.
To balance or not to balance is an important issue. It always used to be argued that periodic rebalancing increases the growth rate as it forces you to sell high and buy low. More recently the opinion seems to be the opposite that you should ride the momentum of an increasing asset price. My own research shows there´s not much in it. The Permanent Portfolio and Golden Butterfly both show increases in growth rates but virtually unchanged SWRs when not periodically balanced.
For investors with traditional bond/equity portfolios The main issue is whether the investor is going to be happy if his initial portfolio asset weighting changes significantly with time. Some of the Income Harvesting strategies which such as "bonds first", or "take income from highest growth asset" can result in a 100% allocation in equities sometimes many years into drawdown - even if the SWR is optimised and the portfolio survival rate unaffected.
The strength of portfolios such as the Permanent Portfolio and the Golden Butterfly lies in the weighting of uncorrelated assets, so allowing a significant deviation from the initial weightings could impact upon the good growth, low volatility and high SWRs of these portfolios.