


I operate a number of different portfolios all of which are income-oriented. I accept that this strategy isn´t the most popular in investment circles and there are some very valid reasons for criticising it. However, whichever strategy one adopts - living off dividends or drawdown from the capital there are compromises. If one has a total market or growth biased portfolio in retirement one is usually forced to invest 40% or so in low growth financial instruments such as bonds or cash in order to reduce the volatility of the portfolio so that erosion of capital is minimised when drawing down during market downturns. This reduces the total return from the portfolio.
Investing for dividends restricts the pool of shares and geographic regions that are available. The SP500 outperforms the FTSE100 but has an average yield of less than 2% compared to the nearly 4.5% of the FTSE100. Shares paying a reasonable level of dividends are generally mature, low-growth companies or utilities so there are non of the often spectacular share price gains associated with the technology sector. However, the managers of dividend companies strive to maintain their payouts even during times of market crisis - their share price may follow the market down by 30-50% but the fundamentals of the business haven´t changed so they can usually maintain or even increase their dividends when the market crashes.
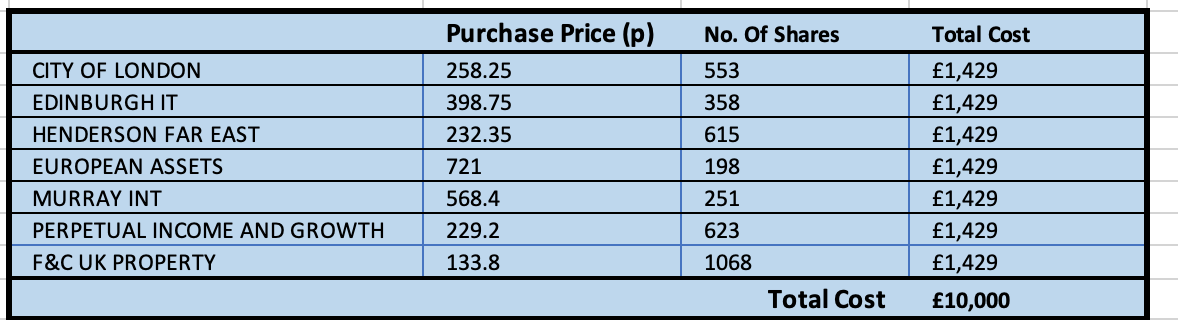
A dividend portfolio strategy certainly isn´t for everyone and is probably not appropriate during the accumulation phase of retirement planning. It´s certainly worth considering when the objective is income and not capital protection or reduction in volatility. So in much the same way that many investors increase their bond holdings on the run-up to retirement, I reoriented my portfolio to be income-generating. I started this prior to the 2007/8 crash (the FTSE peaked in summer 2007 and bottomed out spring of 2009 nearly 50% down) so it’s interesting to review how things worked out over the last 12 years or so. Here I´ll look solely at my Investment Trust portfolio and to simplify things I´m assuming I invested £10,000 across the 7 trusts at the end of 2006 - pretty much the top of the market.
So how did the dividend payouts fare?
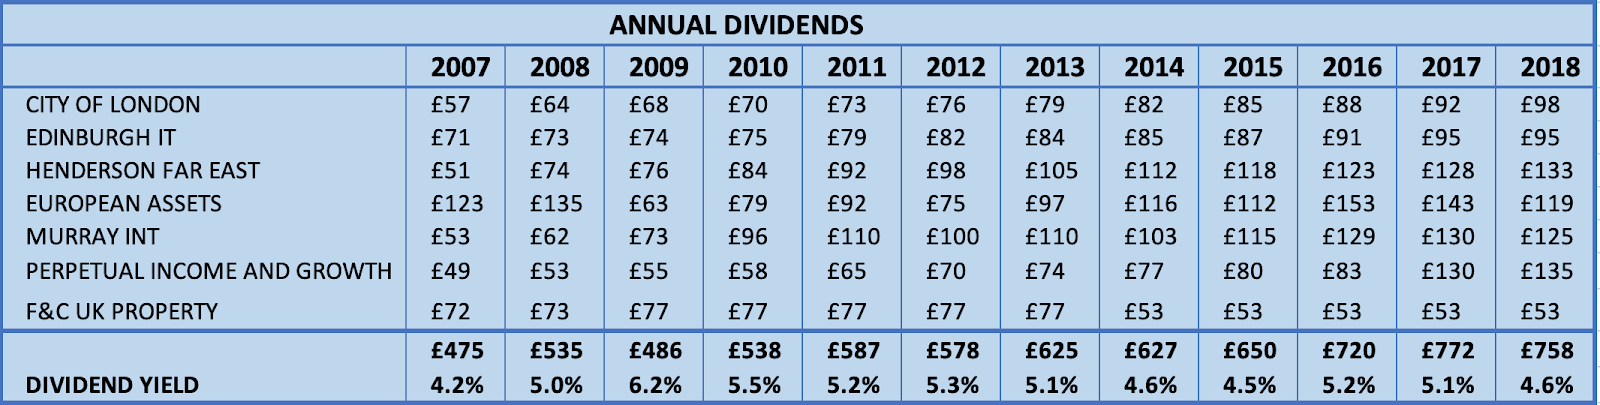
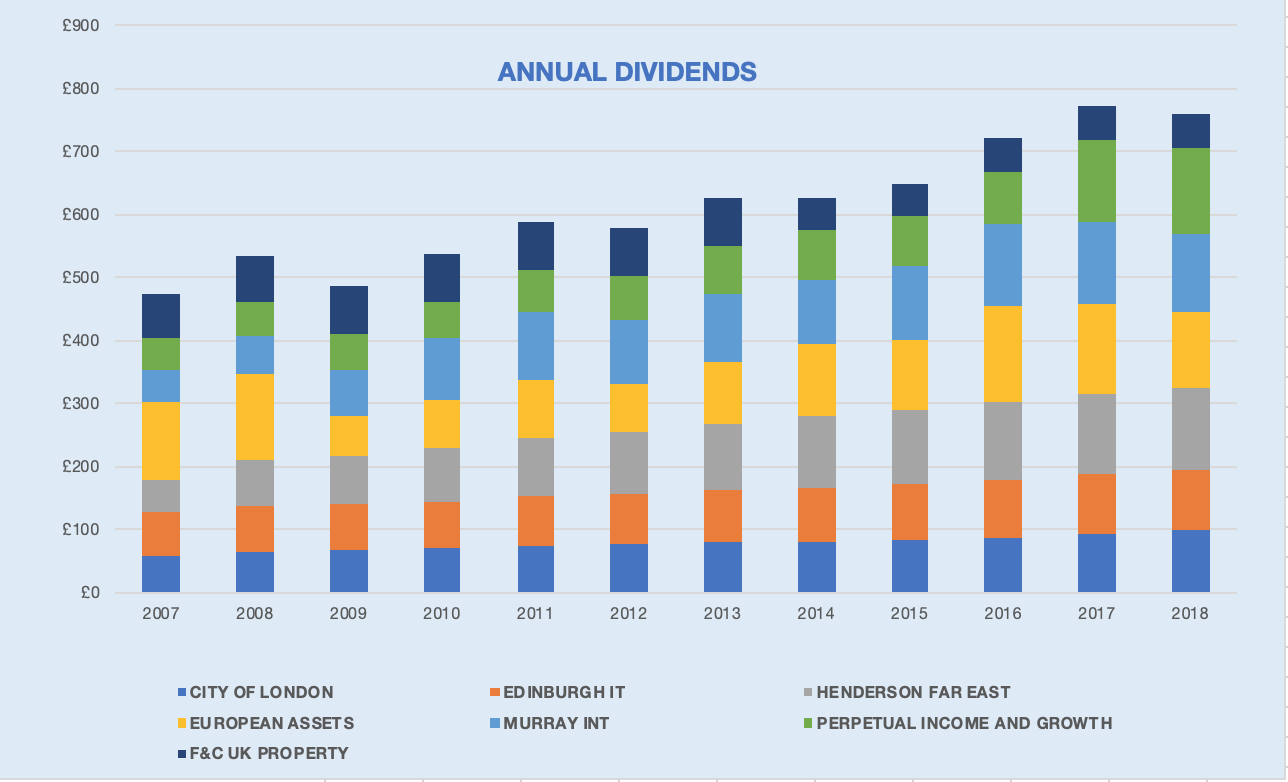
Total dividend increased from £475 in 2007 (yield 4.2%) to £758 in 2018 (yield 4.5%). The average annual increase was 4.3% compared to an annual RPI of 2.9%. There were however 3 years when dividends were reduced compare to the previous year with the worst decline being at the depth of the market crash in 2009 (-9.25).
Portfolio Value
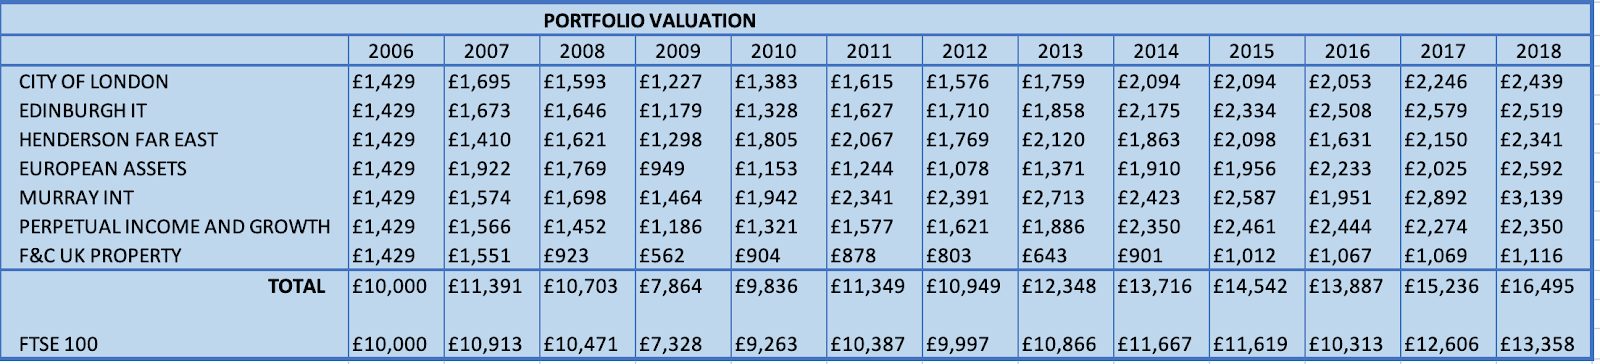
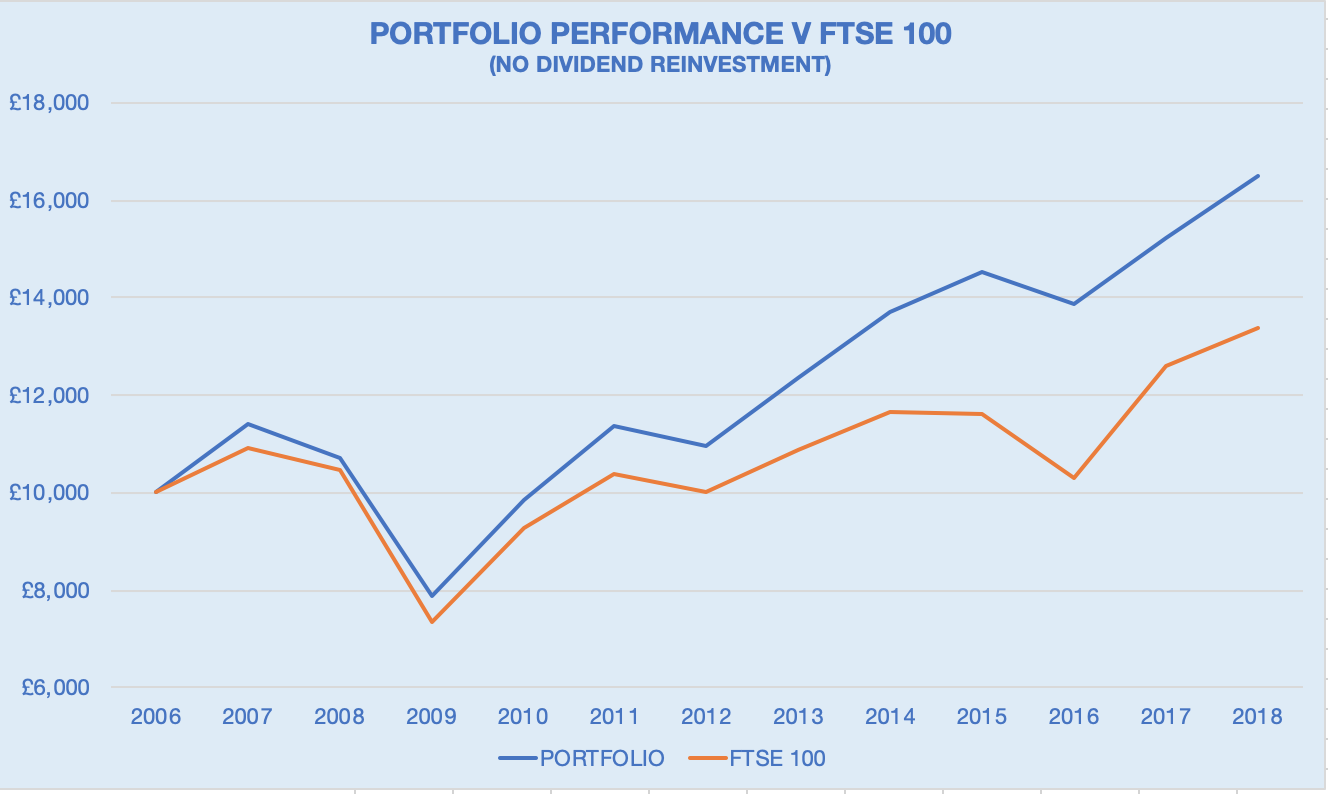
The portfolio increased in value (without reinvestment of dividends) from £10,000 to £16,495 over the period to 30th December 2018, an annualised increase of 4.7% compared to 2.7% from the FTSE100 (capital only).
Conclusions
Actions