


Readers of some of the more popular UK finance forums will have the impression that the choice of a global fund is easy. The de facto fund for many investors is Vanguard`s Global FTSE All Cap Index Fund. With over 7000 holdings including emerging markets and small companies, annual charges of only 0.23% it is probably the lowest cost and most diverse global index tracking fund available to UK investors.
Not For Everyone!
There are however reasons that it may not be ideal for every investor:-
It is a fund, not an ETF:- Many platforms penalise fund holders with higher annual fees than ETFs or shares. For instance, AJ Bell charges 0.25% annually for fundholding. A £200k SIPP portfolio with them will incur annual charges of £500 if invested in funds but only £120/year for an equivalent ETF portfolio. Funds also are less transparent to trade. Prices are only fixed once a day so often the purchase or selling price is unknown until the deal is completed. Whereas with an ETF you know the price at the moment of making the trade. Maybe not a big problem for buy-and-hold investors but not knowing the price at which you buy or sell can be niggling.
Fear of Volatility
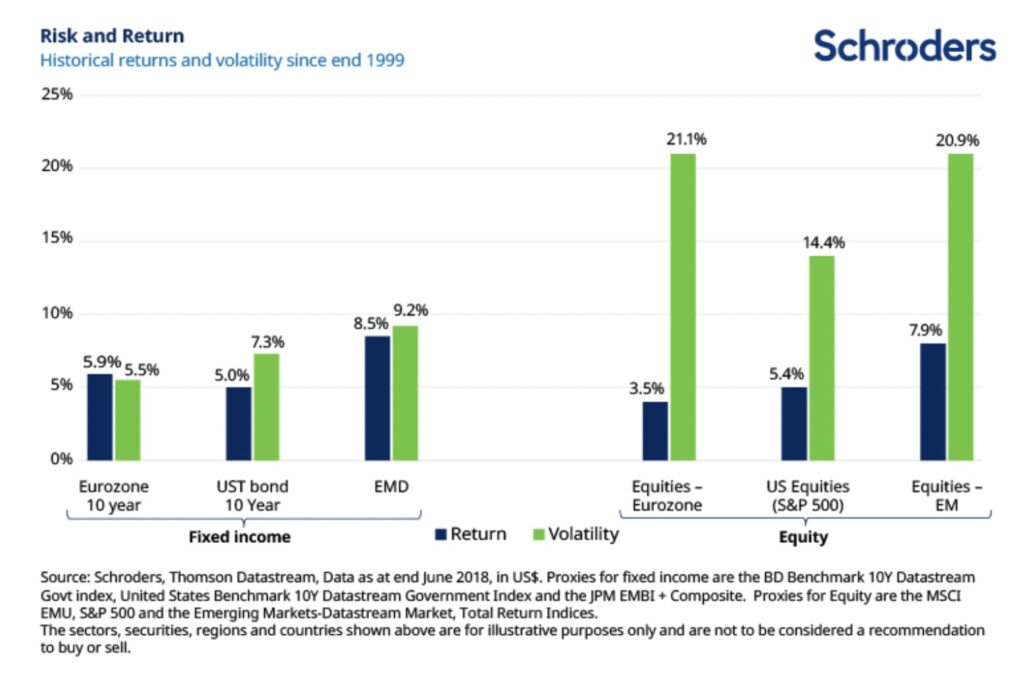
Around 23% of the FTSE All Cap Index are Emerging Market Equities. As the chart below shows this sector has outperformed the European and US markets. Since 1999 the EM sector has had a real annual return of 7.9% compared to 5.4% for the S&P500. But the Emerging market stocks are volatile at 20.9% compared to 14.4% for the S&P. This does impact the FTSE All Cap which is more volatile than the FTSE All-Word Index (no Emerging Market) but probably not to such an extent that it should be a big worry.
Small Caps Out-Perform But are More Volatile
The big difference between the FTSE World Index and the All Cap Index is the addition of smaller companies to the All Cap Index. Historically smaller companies outperform larger companies but like the Emerging Market sector, they are more volatile.
Fear of Volatility Unfounded?
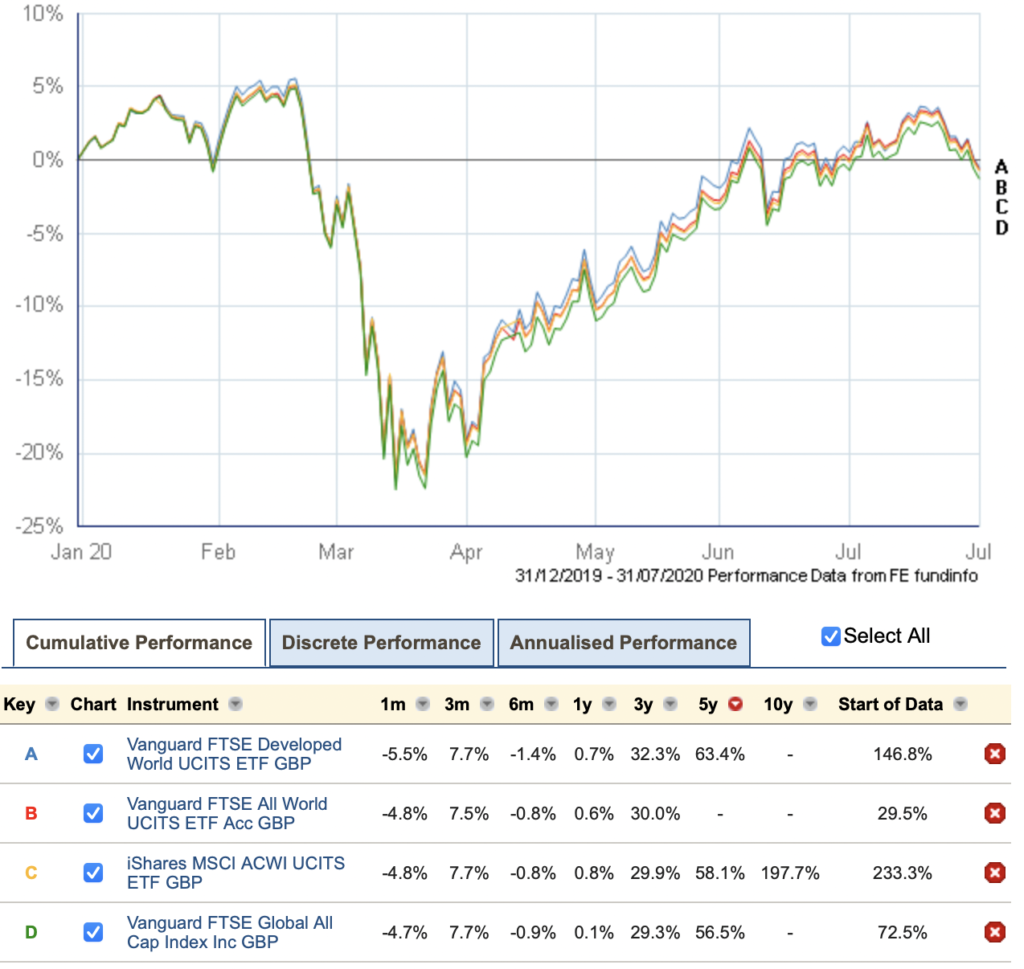
Although logic says that if you add a volatile asset to a portfolio it must therefore increase the volatility of the portfolio in practice the effect is not too significant. Certainly, over a 5-year time period, there was very little difference in volatility between the global indices irrespective of whether they contained Emerging Market or Small-cap stocks. In fact, there were negligible differences in the decline of the various indices during the March 2020 market turmoil:-
The Main Global Indices
Firstly I`m going to concentrate on the 5 common Global Indices that are available through. Of course, in practice, there are some variations in fee and slight differences in tracking errors but the first choice for any global tracker investor should be which index to track. This is likely to have a far greater impact on long-term results than the other factors.
MSCI and FTSE Russell are the two main index providers for Global equities. The most common FTSE Global Indices are:
- The FTSE World Index
- The FTSE Global All Cap Index
- The FTSE Developed Index
The two most popular MSCI indices are the:-
- MSCI World Index
- MSCI ACWI
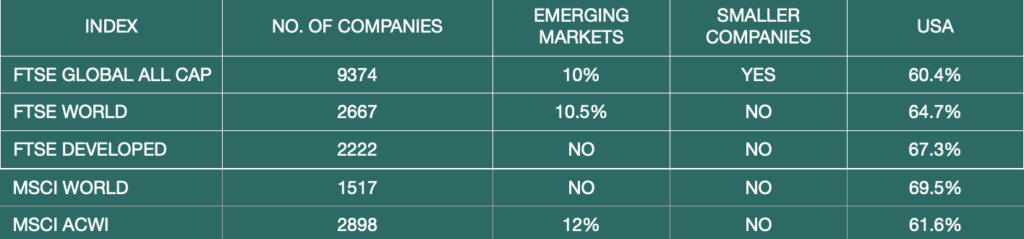
The FTSE Developed Index and the MSCI World Index are similar as they both target larger companies in developed economies. The MSCI ACWI is their World Index plus Emerging Markets. The FTSE World is basically the Developed World plus Emerging Markets and the Global All Cap adds Smaller Companies to the mix.
The tables below compare their main characteristics and relative performances:-:-
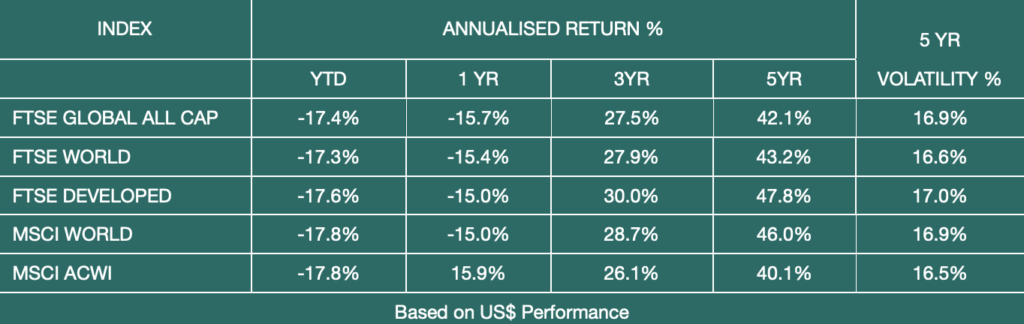
The two Developed World Indices the MSCI World and FTSE Developed World outperformed the other indices over 5 years. These were the indices with the higher US weightings and the USA was the star market performer during this period with the FTSE US-only index growing by 72%. Perhaps more surprising is that there was little variation in index volatility and that it wasn`t the indices with Emerging Markets and Smaller Companies that were more volatile but the Developed Market Indices probably due to the collapse in values of the technology sector which drove so much of the US growth during the past few years.
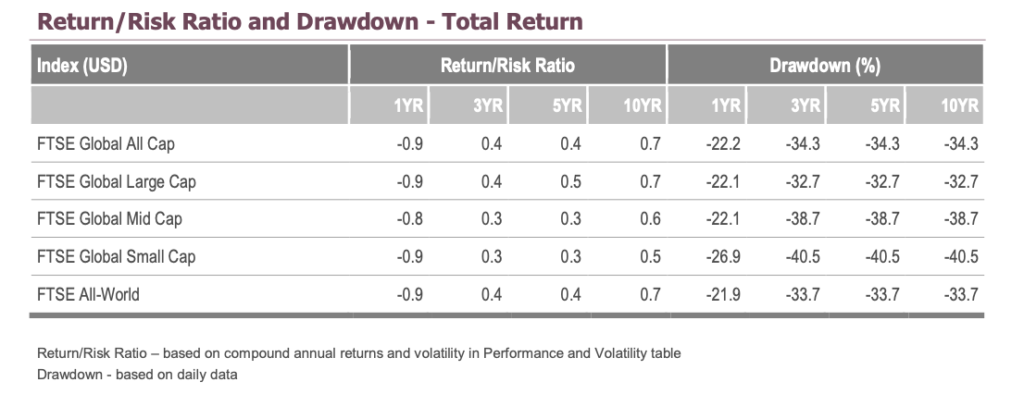
The table below is an interesting comparison of Risk/Reward and drawdown of the major FTSE Global Indices. The All Cap and All-World have near identical characteristics. The smaller company constituent of the All-cap index has made no difference to the risk and volatility of the index even though the Small Cap index is riskier and has larger drawdowns. Perhaps the lesson to be drawn both from performance measures and risk/volatility is that the three main global indices are dominated by their larger constituents such as the US technology sector and their performance swamps the smaller constituents.
So Which is the Best Index For Most Investors
Normally at this point, I would have come to a conclusion about the optimum Global Index for both me and other investors. When I start a blog it is very usually an exercise in research where I am trying to collate sufficient data to come to a conclusion. But so far the evidence is very inconclusive. Any differences in performance between the major global indices over the last 5 years or so have just been driven by their relative exposure to the US market. So those indices that have more constituents such as the FTSE All Cap have inevitably a reduced US content and therefore have performed worse than more concentrated Indices such as the MSCI World or FTSE Developed World. What is clear is that the MSCI ACWI index which is Developed World + Emerging Markets has been the worst performer and as a general rule the Emerging Market sector whilst a good performer has not enhanced performance to the same extent as the Smaller Companies sector.
The general wisdom is that more is better. The more companies one invests in through an index the lower the risk. It is for this reason that the FTSE All Cap Index with over 7000 companies is generally recommended. The only problem with this argument is that these indices are market capital weighted so their performance tends to be dominated by the top 100 to 200 companies with the others barely moving the performance needle. For instance, 70% of the MSCI World Index with over 1500 companies is represented by fewer than 200 companies, and 50% of the index is represented by 64 companies.
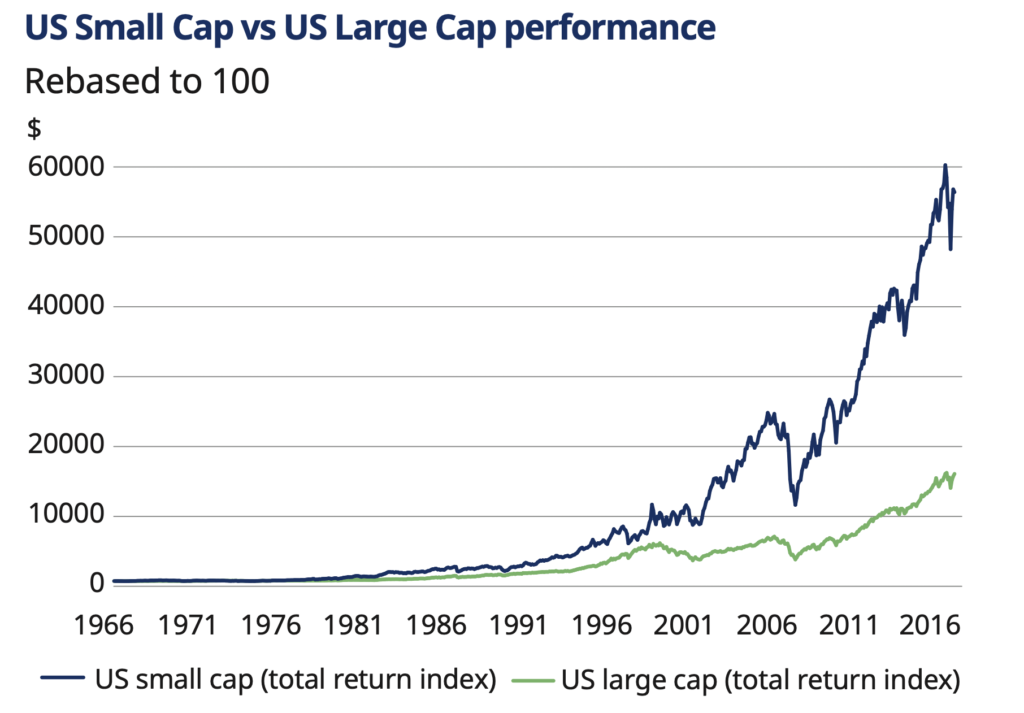
So the theory that more is better may not be borne out in practice. I wanted to dive a little deeper into this using historical data going back further. Most of these Indices and funds derived from them are relatively recent. The Vanguard FTSE All Cap fund was created in 2016 and one of the oldest the Ishares MSCI World in 2009. To go back 50 years to 1972, I have used portfoliovisualizer and compared a portfolio of 100% US large Cap with a portfolio of US Large Cap + 30% US Small Cap. I would have liked to have included international data but they didn`t have the data available. The graph below compares the annualised growth rate for 10-year periods:-
Although there appears to be a negligible difference in performance the portfolio containing Small-cap wins out in four out of the five 10-year periods and over 50 years the large Cap + Small-cap portfolio has a 10.65% CAGR (Compound Annual Growth Rate) and the 100% large Cap 10.34%. This improvement in performance is worth having as if applied to a £100k investment over 30 years this would equate to an additional return of around £10,000. This enhanced performance through the addition of Small-Cap is much as expected - a higher risk, more volatile asset class should produce higher returns to compensate for the risk.
I have simulated an international portfolio using portfoliocharts. US and International Large-Cap weighted 60% to the USA compared to the same plus 30% Small-Cap with the same US weighting. Over 50 years this produced a compound annual return of 7.97% for the large-Cap and 8.28% for the combination Large-cap+Small. Strangely exactly the same 0.31% growth advantage to the US Large/Small combination. Substituting Emerging Market for Small-Cap boosted the large-cap-only portfolio by only 0.1%.
For retirees in drawdown, it is interesting to see how a 100% Global Equity portfolio would perform. Timeline gave the following annual maximum drawdowns for a £100k portfolio, 0.35% expense, 35-year retirement and a 95% success rate for a UK investor:-
- £3428 100% Global
- £4065 70% Global 30% Emerging Market
- £5010 70% Global 30% Global Small-Cap
I would take the absolute maximum drawdown values with a pinch of salt but there is such a difference in relative performance that it must be concluded that the addition of the Small-Cap sector significantly increases the potential drawdown income.
The Optimum Index to Track
At last, I think I can come to a reasonable conclusion about the best choice of Global Index
The differences are relatively small between the performance of the three main indices (I have now excluded from consideration the MSCI ACWI Index):-
- Developed Global Market FTSE Developed and MSCI World
- Developed market + Emerging Market FTSE All World
- Developed market + Small Cap + Emerging Market FTSE Global All Cap
The addition of Small-Cap does improve the performance of the Developed World Indices without significantly increasing the volatility (risk). Adding Emerging Market exposure via the FTSE All-Cap only marginally improves performance so either a FTSE All-Cap fund or an FTSE-World fund/ETF would be very reasonable choices probably determined by their charges and availability as funds or ETFs.
To Hedge or Not to Hedge?
All the global funds are US$ denominated so returns are impacted by the US$/Sterling exchange rate. In recent years this has been highly beneficial to the UK investor with the collapse post-Brexit of Sterling. Whereas a US investor in the MSCI World index would have seen a 15% fall over the last year.
Careful With ETFs in Non-Tax Sheltered Wrappers
The only major consideration with ETFs is when they are held outside a tax-exempt account such as a SIPP or ISA. Providing a dividend-paying ETF is chosen - no problem. But an accumulation ETF is a hassle as you enter the somewhat obscure world of Excess Reportable Income. Unlike a fund or a dividend-paying ETF where you should receive an annual broker statement of dividends paid to make tax returns straightforward. But with an accumulation ETF you have to do some work yourself. There is an excellent guide to this published by Vanguard. The work required isn`t complicated but needs some research as the information needed is often quite tricky to find. You need to know how many shares you owned at the end of the ETFs reporting period then look up the excess return (in effect the dividend) paid by that ETF. The extra complication arises if you need to calculate any capital gains when you sell. The total excess returns received should be deducted from the ETF`s selling price as this was basically income received and any due tax paid. So best to avoid accumulation ETFs in non-tax-sheltered accounts!
Popular Funds and ETFs
Performance Summary
Conclusion
A much-quoted expression is “The only free lunch is diversification“. In the case of global index funds, this really hasn`t been the case over the last five years. The most diversified fund the Vanguard FTSE Global All Cap was by far the worst performer and the best performers were the more concentrated large/mid-developed company ETFs/ funds. This was primarily due to the exceptional performance of the US market in particular the large company tech. sector. The more diversified the fund the less weighting towards this sector.
Five years is a short period in the likely investment lifetime of most retirement investors so it is more important to consider the long-term prospects. Unfortunately, we have to rely on the past and hope that it does indeed repeat itself. The performance of the leading US Tech companies has dominated the performance of all the World Indices over the last few years. The consequence of this is that the addition of Emerging Companies to an index dilutes its performance and the addition of smaller companies (Vanguard FTSE Global All Cap) further dilutes performance but with a slight reduction in volatility.
Having said that I hold investments in all three sectors - Ishares MSCI World, Vanguard FTSE All-World, and Vanguard FTSE Global All Cap. I won`t be switching out of any of these as the potential long-term performance differences are fairly marginal. For a portfolio in drawdown, the slightly lower volatility and reduced drawdown of the FTSE All Cap gives it a slight advantage even if some performance is sacrificed. If the objective is shorter-term the FTSE Developed World Index might be a better option.