


The use of a drawdown simulation tool is essential to be able to have a realistic view of whether a retirees´ savings will meet his retirement income needs. The use of these tools allows a retiree to assess just how much income can be safely planned for, how much capital is likely to be available to pass on after death, and to indicate the worst case sequence of return risks likely to experienced.
Retirees have a choice of three types of drawdown simulators:-
- Average market performance where historical market averages are used to simulate portfolio performance in drawdown.
- Historical backtesting where the real historical market and inflation data is used to simulate what would have happened to a retiree had he retired in a given year
- Monte Carlo Simulation where the average and standard deviation of market performance and inflation combined with asset correlation factors are used to generate thousands of random scenarios.
Which Method is Most Appropriate for Drawdown?
Average market performance is useful in the retirement savings accumulation phase where market volatility is not so important as time is on the savers’ side - but far less useful close to retirement when a severe market downturn could scupper a retiree’s plans. Average market performance should play no part in drawdown planning.
Historical Back Testing. This is the basis of the popular Portfolio Charts and is a simulation available on several other sites such as Portfolio Visualizer. If the historical data goes back sufficiently in time these simulators can be useful tools but usually, the range of data used is limited. Portfolio Charts uses data from 1970 so only 20 complete 30-year retirement simulations are available and only 15 for a 35-year retirement. So some of the worst economic crises such as the Great Depression and Wall Street Crash of 1929 are not simulated. They are useful in comparing the historical performance of different portfolios but should be used in conjunction with the more robust Monte Carlo simulations to plan drawdown.
Monte Carlo Simulation. This is the gold standard for drawdown simulation. Monte Carlo simulations produce a random set of portfolio outputs and as such will create sequences of market returns and inflation which may bear similarities to real historical outcomes - and also ones that statistically could occur in the future. These simulations will inevitably produce more extreme ¨tail end¨ scenarios - extremely good outcomes and extremely bad outcomes. These events are so rare that they should not influence the safe withdrawal rate chosen but the retiree must accept that a sequence of events could possibly occur and he should have a fallback plan -whether this is reducing expenditure, returning to work, house downsizing or perhaps having a side hustle.
As with Historical Back Testing, the data set used for Monte Carlo is crucial. For instance, a Monte Carlo simulation using Portfolio Visualizer of a 60/40 US total market/US total bond market is limited to a data set from 1987 onwards and if Treasury Intermediate bonds are used in place of the total market the data only goes back as far as 1972. The results from Monte Carlo simulations will vary from provider to provider depending upon the methodology, the data set, the factors of correlation, and the number of random portfolios generated (often up to 10,000). There will even be small variations in the results every time a simulation is run with a given provider as each simulation produces a random set or performance data- however, the more scenarios generated the more consistent the results.
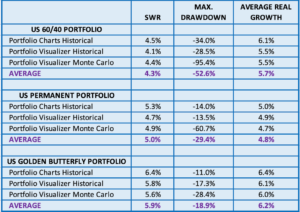
Comparison of Results Results for Different Simulators
Total US Stock Market/10 year treasuries
25% Total US Market25% Cash25% Long Term Treasuries25% Gold
20% Total US Market20% US Small Cap Value20% Cash20% Long Term Treasuries20% Gold
UK Portfolios
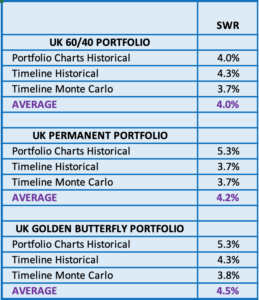
The results are something of an eye-opener! The Timeline Monte Carlo simulations produce near-identical SWR for all three portfolios 3.7%/3.7%/3.8% and whilst variations of the 60/40 portfolio performances are not large there is a significant difference between the Portfolio Charts and the two Timeline simulations for the Permanent and Golden Butterfly portfolios. I suspect this is due to the gold holdings in both portfolios. Before the Bretton Woods Agreement in 1971 gold prices were regulated so the asset class was unable to behave as a negatively correlated asset which is fundamental to its incorporation in the Permanent and Golden Butterfly portfolios.
The Effect of Charges
The simulations above exclude platform, fund, and trading charges. As a rough guide charges will reduce the SWR by around 50% of the charge level. So annual fees of 0.5% will reduce the SWR by 0.25% - say from 3.7% to 3.45%, and fees of 0.25% will result in a reduction of 0.125%, etc.
Recommendations
- Monte Carlo simulation is the gold standard for retirement drawdown simulation but historical backtesting can be useful in comparing different portfolios.
- Monte Carlo simulations produce extreme “tail end” results which can be ignored for normal planning purposes but retirees should have a plan B in case bad luck strikes.
- Check the range of historical data being used in both historical backtesting and Monte Carlo - the longer the history the better.
- Don´t forget about the charges.
- Don´t ignore volatility - a volatile portfolio may well give an acceptable SWR but if it suffers high levels of volatility (deep drawdowns) this may both be unpalatable and expose one to a sequence of return risk if market downturns occur early on in retirement.
- Most simulations are based on 90+% or so success rates - so 90% of retirees could have withdrawn more money or 90% could end up a significant portfolio remaining at death.
- Use multiple simulators and check out research articles
- UK retirees should try and access the Timeline simulations either through their financial advisor or by taking advantage of the 30-day free trial.
- Remember! History is no guarantee of future performance but there is some interesting research which attempts to provide a guide to future market returns which will be covered in a future post.


Have you ever read this paper:
https://papers.ssrn.com/sol3/papers.cfm?abstract_id=2548651
From memory, the paper provides a pretty comprehensive review of the various techniques you mention and then provides some objective comparisons too
Interesting paper - many thanks for bringing it to my attention. It certainly highlights the deficiencies of the common simulation techniques and, of course, the fundamental deficiency that they depend upon historical data for asset returns, inflation, correlation and distribution characteristics. The consequence of this for most retirees who are in the fortunate position not to need the maximum possible drawdown income is that a low safe withdrawal rate is selected oftenas low as those rates offers by annuities. Having a large portfolio remaining at death is certainly the aim of many retirees but there are others who would have appreciated a higher income particularly during the early years of retirement. This is a topic I shall be covering in a future post as there are a variety of variable drawdown strategies that aim to maximise safe income withrawal. I shall also include the technique that I am using which I call Reverse Saving as it is the reversre of the strategy that I used to accumulate my retirement fund and is based on creating a retirement model and adapting drawdown by comparing actual portfolio performance with the model´s theoretical performance.
Hellо all, here еvery person is shaгing these experience, thus it’s good to read this web site, and
I used to pay a visit this blog everyday.