
I was reviewing my Investment Trust Income portfolio the other day and thought it would be interesting to compare it with my Total Return drawdown portfolio. If anyone has looked at my post on my own retirement income strategy about generating £40,000/year almost tax-free you will know that my investment income is split between producing dividend income from an Investment Trust Portfolio and drawing down income from a 65%/35% equity/bond portfolio with Vanguard. I have around £250K invested in both with the income portfolio yielding about 5.6% and I am drawing down 5% from the Vanguard portfolio using a ratchet-style Variable Drawdown.
No Arguments Here About Living Off Dividends! I have written various posts on the subject of dividend income and won`t revisit the arguments here. However, the other day I was listening to an early episode of the Retire with Style Podcast discussing retirement income strategies (a great series of Podcasts, non-USA listeners just need to skip the episodes about Social Security, Medicare, etc.) and having dealt with drawdown strategies Prof. Wade Pfau was asked about dividend income. His reply was that there had not been sufficient research on the subject to give an opinion. In some ways, this is surprising as it is a perennial topic but I suppose there whilst is a wealth of worldwide total market return data, some going back 100 years, but dividend data is not so prevalent apart from market average yields which is not helpful. Dividend investors search for companies with certain characteristics such as those defined by the Dividend Aristocrats or indices such as the FTSE High Dividend Yield Index. These different indices have their own rules and historical data is limited. So researchers have very limited data sets available and this is probably the reason for such limited academic research.
In general, under-spending is a far greater problem in practice than running out of money. This is a reason that dividend income is attractive to retirees such as me, even though research shows that Total Return Investing should allow for greater diversification, lower volatility, and the ability to use cost index tracker funds. The psychological barrier for many of us who have saved hard during our working lives is the reluctance to sell hard-earned assets and fear that we will outlive our savings. It is for these reasons that a very high proportion of retirees living off their portfolios under-spend and die leaving significant inheritances. This is despite the evidence that under-spending is a far greater problem in practice than running out of money.
My Income Generating Box. I view my dividend portfolio as a black box that produces income that generally increases each year and rarely declines. What happens within the box is not of great interest. Markets may decline by 50% but the income continues at pretty much the same level.
However, the reality must be faced that if the long-term market returns are around 3% or 4% above inflation, and as in my case I have a portfolio that is yielding 5.5% then that level of inflation-linked dividends cannot be sustained. Either the capital has to be eroded or the dividends have to lag behind inflation. In practice, the ideal would be a combination of both. A recent Morningstar report on Retirement Income strategies indicated that a retirement income that failed to match inflation by about 1%/year actually matched the retirement spending patterns of many retirees - as you age you spend less. My Investment Trust Income portfolio contains a mix of trusts some of which will eat into capital to maintain payouts, others will at some stage cut dividends to reach a sustainable level and others will completely fall by the wayside. The end result will be a combination of capital reduction and increasing non-inflation matching dividends. But active portfolio management will be essential. Taking dividend income rather than drawing down could be considered as “losing money gracefully!”
My Investment Trust Dividend Portfolio
Why Investment Trusts? I have discussed my preference for Investment Trusts previous posts so will summarise my main reasons:-
- Their ability to retain income to build up reserves to smooth out dividend payments
- Transparency - decades of annual reports and historical data are usually available
- Closed-ended - no need to sell investments to meet customer redemptions unlike funds (important for property, private equity, and other poorly liquid sectors)
- Reasonable costs compared to other actively managed investments
- The separation between fund management and the board of directors
The negatives:-
- They are actively managed investments. There have been many examples of trusts losing their way. Most recently what had been reliable income generators such as Perpetual Income, Edinburgh Investment Trust, Keystone, and Temple Bar have been merged, or taken over and are no longer contenders for income portfolios
- A portfolio of actively managed investments needs monitoring and periodic adjustment. This is not like purchasing an index fund that can bebought and largely forgotten.
- Costs are higher than index funds. 0.5% to 1% trust fees are the price for active management.
My approach to IT selection is described fully in my post reviewing the portfolio in September 22 This is my current portfolio which has changed a little since then:-
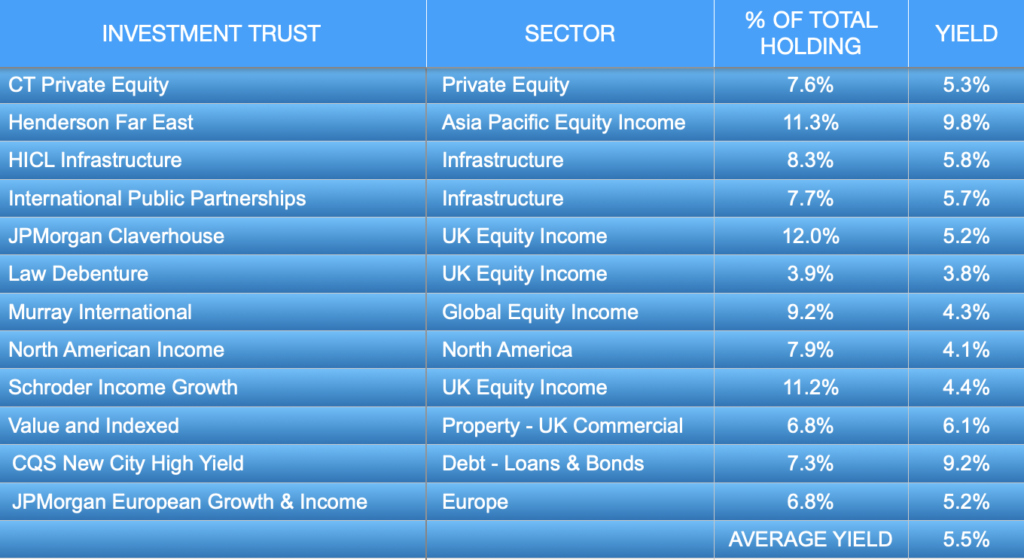
Within the portfolio, there are a couple of Investment Trusts that offer high yields but very little likelihood of dividend growth such as Henderson Far East and CQS High Yield. This ties in with my objective of weighting income towards the earlier part of retirement when spending is likely to be at its highest.
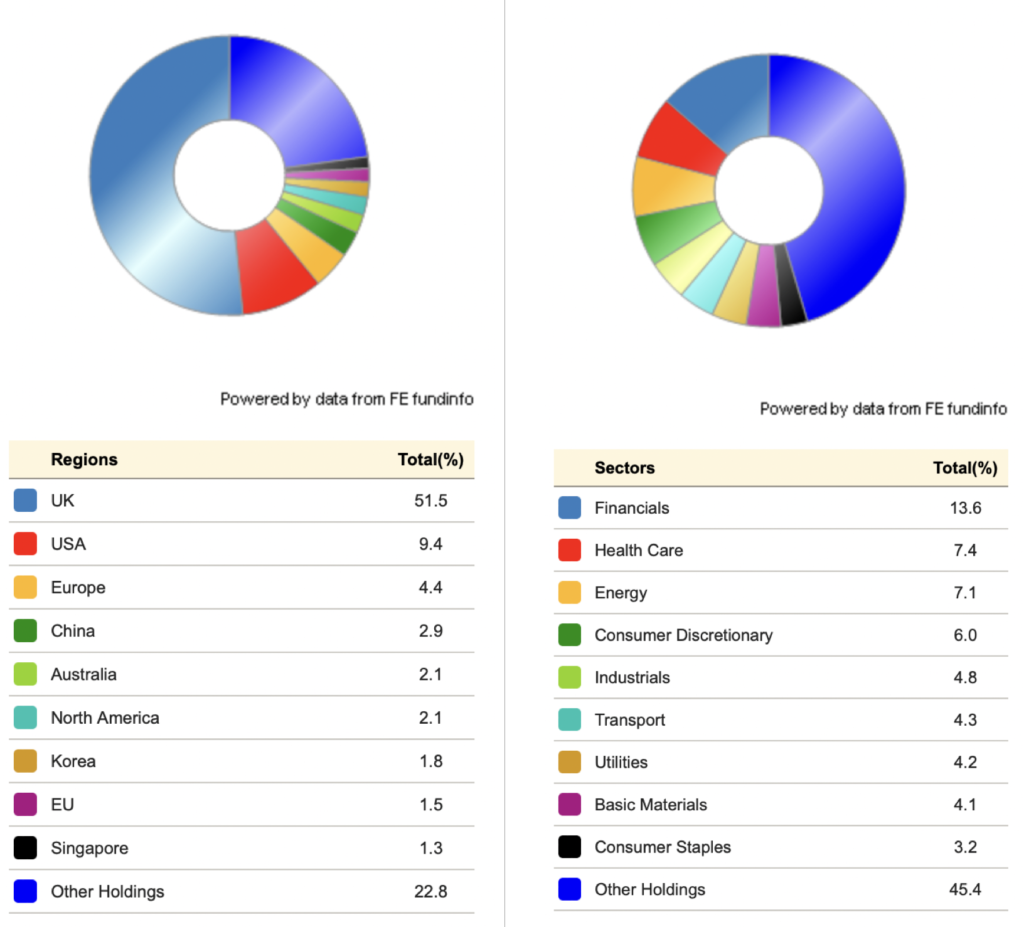
One of the drawbacks of dividend income is the potential lack of diversification by sector and geography. Good dividend payers tend to be concentrated in certain sections and geographic locations plus it is difficult to avoid having a heavy weighting towards the UK where the market has always favoured high dividend payers. The graphics below show the geographic and sector allocations:-
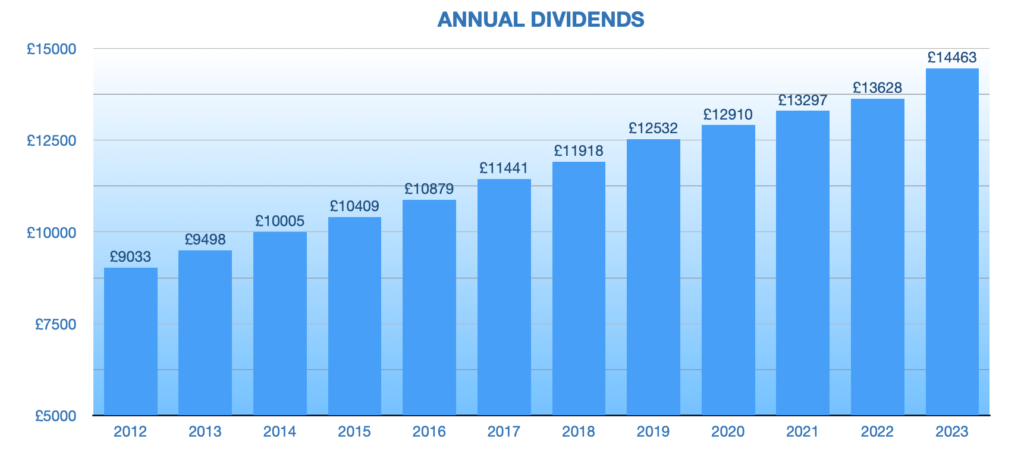
Dividend History
Dividends have been estimated for 2023 and based upon forecasts total dividends should increase by around 6% in 2023 compared with 2022 - not bad but certainly below the 10% or so CPI. From 2012 to 2022 dividends grew at an annualised rate of 4.2% compared to a CPI of 3% and RPI of 4.24%. Dividends increased every year with the smallest increase being 2.5% in 2022.
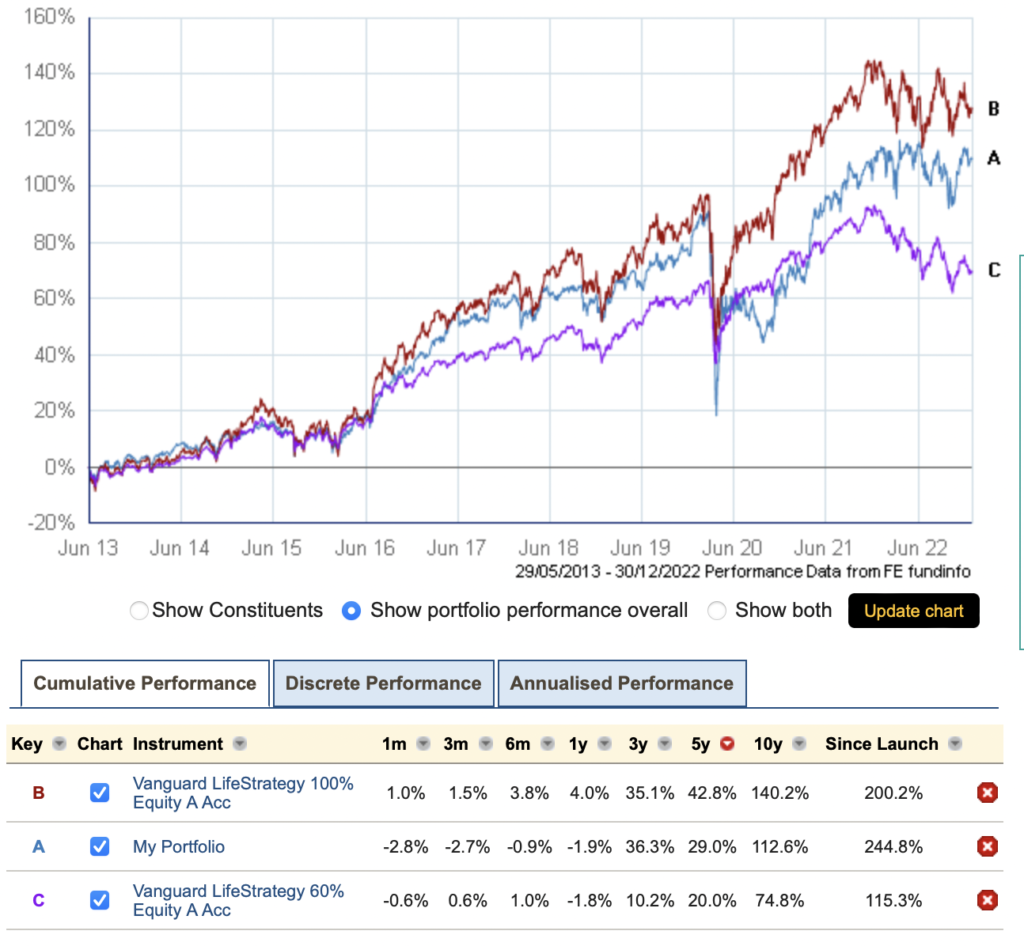
10-Year Total Return Performance
The graph below compares the Investment Trust Income Portfolio’s Total Return (dividends reinvested) compared with Vanguard’s Life Strategy 100% and 60% Equity Funds.
The 100% equity IT Portfolio outperforms LifeStrategy over 3, 5, and 10 years but is soundly beaten by the LifeStrategy 100% equity fund. As expected, the two 100% equity portfolios outperform a fund that contains 40% bonds. This higher growth, of course, is at the cost of higher volatility. In the March 2020 market crash, the IT portfolio fell 37.5% compared to the LifeStrategy 60% Equity’s fall of 17.5%.
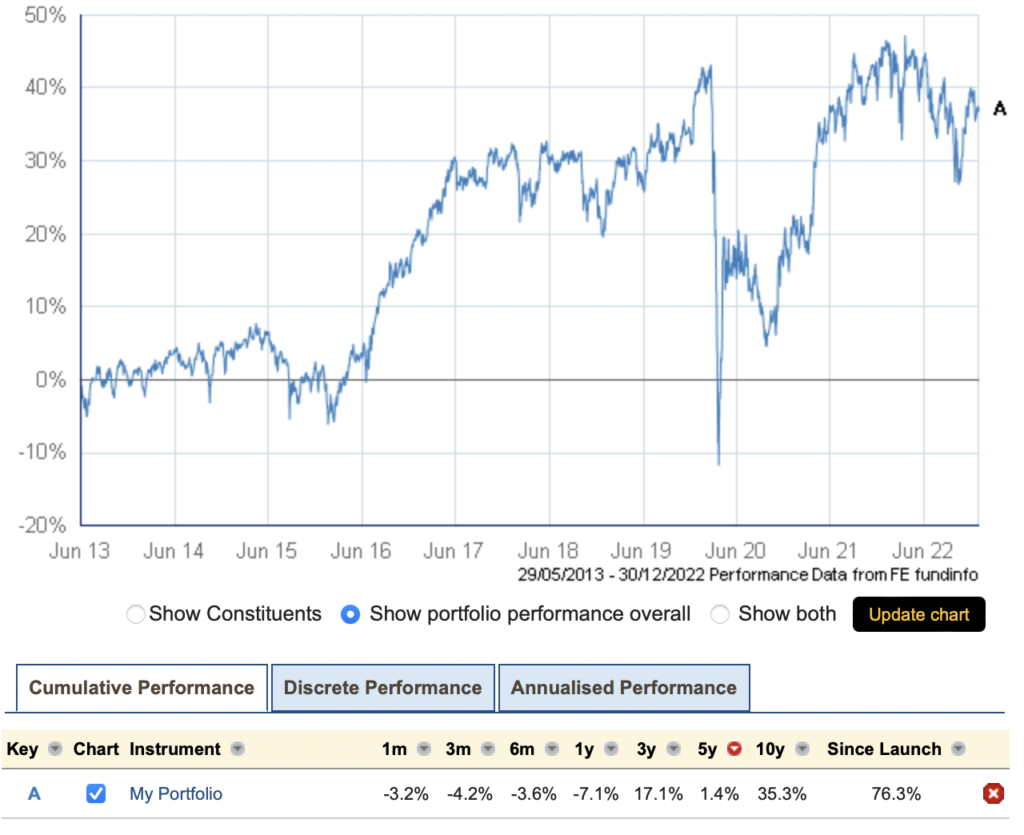
Investment Trust Performance After Taking Dividends
The lack of a free lunch when taking dividends is clearly shown in the graph below. The 35% growth over 10 years (3.1% annualised) after taking inflation-linked dividends seems very reasonable but it must be remembered that it was a good period for the markets with the FTSE World Index growing at an annualised rate of 8.4%. The volatility of the portfolio will also be frightening for some retirees declining 50% in March 2020 (though recovering in 18 months.)
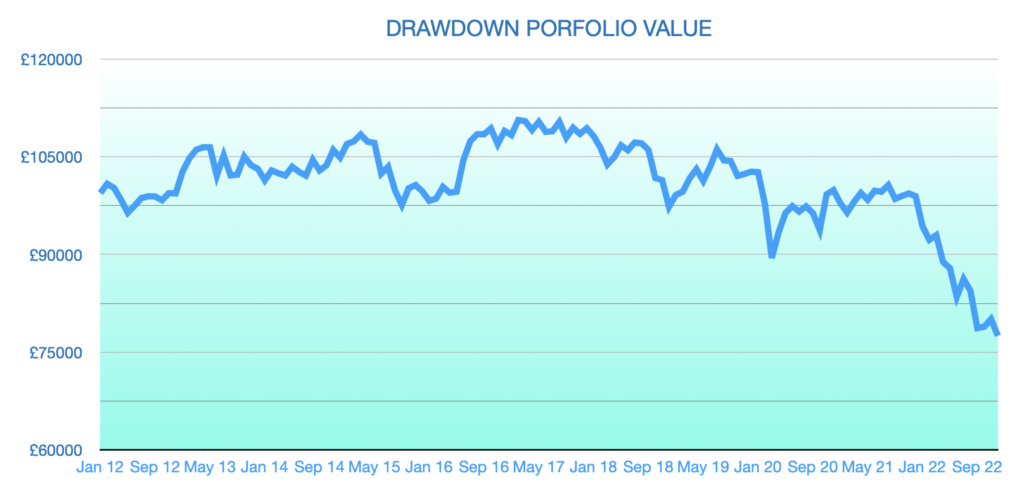
Drawdown versus Dividend Income
Out of interest, I have compared the performance of a drawdown portfolio taking the same level of income as from the Investment Trust portfolio. For the drawdown portfolio, I have used Vanguard`s LifeStrategy 60% Equity Acc. and have assumed an initial portfolio value on January 1st, 2012 of £100,000 for both. The income taken by selling units in the LifeStrategy drawdown portfolio was equal to the annual dividends of the IT Income portfolio but spread evenly over the twelve months.
At the end of 2022, the drawdown portfolio had a value of £77,522 and rather surprisingly the IT Portfolio was valued at £159,717! I haven`t analysed the reasons for this performance difference but suspect it’s a combination of the fall in bond prices due to increasing interest rates that have hit the LifeStrategy Fund and the revival in the fortune of value-oriented UK companies.
Conclusions
The risk of taking a high withdrawal rate from a portfolio is clearly illustrated above. In 2012 the IT portfolio was yielding 6.7% and the level of dividends increased on average by the CPI. This is an unsustainable drawdown withdrawal rate as an SWR of around 3.5% would be normally recommended.
The advantages of dividend income are:-
- A higher initial income is possible
- The Sequence of return risk is reduced
- Psychologically there isn`t the feeling of spending capital
- 100% Equity Produces Higher Returns Than an equity/bond portfolio
- The dividends just arrive!
- Any reduction in the capital is gradual and there is no risk of completely depleting it
but there are disadvantages:-
- The portfolio must be actively managed
- Each trust is actively managed with higher costs than an index tracker and the risk of mismanagement
- Less diversification than a global index tracker
- Far greater volatility than an equity/bond portfolio
From a personal point of view my Investment Trust Portfolio provides me with a higher initial income than I could safely achieve from my drawdown portfolio and its likely profile of a gradually declining real income throughout the years matches my likely needs. Its management is also interesting for me at the moment.
However, the real area of concern is the need to actively manage the portfolio in later years. As I get older I am likely to be less motivated to pay attention to the portfolio and as I discuss in my post on Cognitive Decline there is a risk of mental impairment causing overconfidence and poor decision-making long before there are symptoms of dementia visible to family and friends. A drawdown portfolio using index tracker funds is a far safe prospect for later on in retirement and in the event of not being able to manage one`s finances it is a far simple proposition to hand a one or two-fund portfolio to a family member or professional advisor.
My intention is to continue with the dividend portfolio for a further 5 to 10 years and then switch to a simple equity/bond drawdown portfolio by which time due to age it should be possible to have a safe withdrawal rate of around 6% to 7% which will probably produce an income 25% to 50% higher than the dividend income.