Could your investments survive another 1929 style Wall Street Crash and the subsequent Great Depression?  Two out of four of the simple stock/bond sample portfolios looked at in this post would have survived a 30 year retirement at a 4% inflation linked drawdown.


We all hope that lessons from those catastrophic events have been learnt and that interventions from central banks and governments will soften the blow of any future financial shocks and indeed we have seen effective responses to the banking crisis of 2008 and the Covid-19 pandemic of 2020.

However, there must be a risk that should another crisis occur during the next decade that with interest rates at near zero levels and QE still in place (let alone wound down) and with historically high borrowing the central banks not have sufficient ammunition to respond to a severe global financial shock.

Events such as the Wall Street Crash and the great Depression are once in a lifetime financial disasters that we all hope we´ll never experience again. But one never knows and if there are lessons that can be learnt that allow us to engineer our portfolios to survive a similar occurrence then we would be foolish not to learn from history.

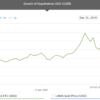
The Wall Street crash started in October 1929 and by 1932 the Dow Jones Index had fallen by 89%.
The impact of the crash was exacerbated by the high level of margin trading which had catastrophic consequences for many investors.  The situation was not helped by mutual funds which unlike todays funds often traded at premiums of up to 50% above their net asset value.

Whilst some shares recovered within a few years the Dow index took nearly 25 years to recover to pre-crash levels, albeit with different constituents as companies were relegated, acquired/merged or liquidated.  Surviving companies were able to maintain or increase dividends post-crash so for some investors the situation was not as dire as portrayed by the graphic of the Dow performance.  In fact in 1930 US companies increased their dividend payouts by more than $2bn.


Causes of the Crash

It is often suggested that the causes of the market crash was speculation and market manipulation that pushed stock priced to unrealistic levels.  However, companies had been enjoying boom times with rising sales and profits which underpinned the stock valuations and typical price earnings ratios were around 20 which would not be considered excessive today.   Often blame is attributed to the UK when business magnate Clarence Charles Hatry and his associates were convicted of fraud which led to a collapse of the London stock market one month prior to the Wall Street Crash. Other economists point the finger at the then UK chancellor for warning that the US market was overpriced.  
 
90+ years on there is no consensus amongst economists for the reasons for the crash.  Benjamin Graham summed up market behavior by saying— ‘In the short run, the market is a voting machine but in the long run, it is a weighing machine.’  Markets are irrational and driven by sentiment and herd behavior in the short run and in the long run rational and driven by the financials.  As we have seen so many times it only takes some off-side event to change market sentiment and instigate a market crash.

The Great Depression

The start of The Great Global Depression coincided with the Wall Street Crash.  However, most economists agree this was not the cause of the depression that lasted until the start of the 2nd World War in 1939 and was characterised by falling GDPs, mass unemployment and falling prices – deflation.


Like the Wall Street Crash  economists still debate the reasons for the depression but it was likely to have been caused by a combination of global factors including the consequences of many countries following the Gold Standard combines with inept government fiscal and monetary policies.  
 
We must be hopeful that lessons have been learnt but there is always another crisis round the corner and is is quite possible that central banks and governments will not have the ammunition available to prevent another financial catastrophe.


Deflation

From 1920 through to 1933 the US experienced deflation.  From 1929 to 1933 consumer prices declined by 25% equivalent to an annual decline of 5.7%.  It took until 1947 until prices recovered to the 1920 level.  As we know from the 1990s Japanese period of deflation falling prices kills consumer demand – why purchase today if it will be cheaper tomorrow?  Low consumer demand, falling prices combined with surprising stickiness of pay levels crippled companies and drove high unemployment.
 

Interest and Bond Rates

Short term interest rates were increased in 1929 in an attempt to calm the stock market but were sharply reduced post-crash.  10 year bond yields remained over 3% until 1935 and thereafter stabilised at around 2%.  With deflation running at 5.7% 10 year treasury bonds were rewarding investors with a real  
yield in excess of 7.5%.


Who Were The Winners?

The obvious ones – those who sold out prior to the crash!  Story has it that Joseph Kennedy Snr. sold out when his shoeshine boy started giving him stock tips. Having done well in the boom years of the 20s he sold out and subsequently made another fortune when he bought back at market lows.  Most weren´t so lucky!

The lucky ones – holders of dividend paying stocks (that didn´t go bust) would have seen there income rise in real terms and with patience capital values restored.

Gold Investors – The US was tied to the gold standard.  Gold was fixed at $20.67/oz until 1941 when a price of $35.50 was set.  If you held gold in 1929 then due to deflation your real yield would be in excess of 5% followed by a boost of 70+% in 1941 when gold was repriced.

Government Bond Holders – with capital guaranteed and real yields of over 7.5% they were sitting pretty.

How Did Retirees Fare in Income Drawdown at 4% Inflation Linked?

A retiree entering drawdown in 1929 at the classic 4% initial withdrawal rate and thereafter adjusted for cost of living would have seen his nominal income reducing due to deflation.  From a $100k portfolio he would start off with $4000 annual income.  This reduces to $3000 in 1923 and it would take until 1944 before his nominal income returned to $4000.

How Long Would The Portfolio Last?

The graph below shows the evolution over 30 years of four different US portfolios in drawdown starting at the peak of the market in 1929.  The portfolios considered are 100% Stocks, 100% bonds, 40% bonds and 60% bonds.  The bonds are treasury 10 year treasury and for stocks Schiller´s simulated S&P 500 with reinvestment of dividends.
The stock element has to be taken with a little scepticism as this was the pre-index fund era so few investors would have had such a diversified low cost portfolio.  But it is worth evaluating these scenarios as today´s investor could easily have an index based fund or ETF so if there were ever a repetition of these economic events these historical performances could be a good indication of how such portfolios would behave.

Lessons from The Crash and Great Depression – Two of the portfolios would have survived a 30 year retirement

100% and 60% bond portfolios would have survived 30+ years of drawdown.  Perhaps not surprising given the substantial real yield of treasury bonds and it is difficult to conceive with our current near zero interest rates that we would ever encounter a similar economic environment.  However it is comforting to know that a conservative portfolio today with 60% government bonds would have survived the worst market conditions for 100 years.  It is also comforting that a Monte Carlo simulation shows that a 40% stock 60% US based portfolio would support a 4.5% withdrawal rate with at 90% certainty of success.

Leave a Reply