The Annuity Puzzle
-
-
- Poor Market performance and volatility
- Longevity – outliving your money
- Inflation
- Spending shocks – large unplanned expenditures
-
Annuity Popularity Not Helped By The Perception of Being Poor Value
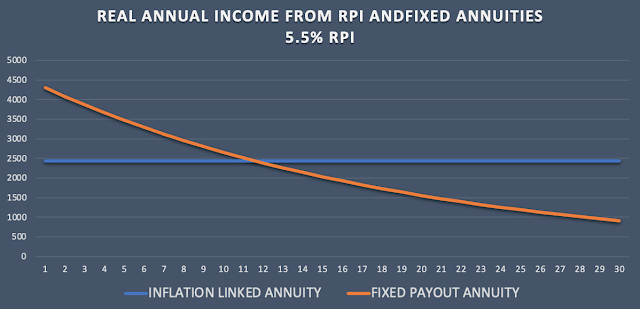
The popularity of pension annuities has plummeted in recent years not helped by their portrayal as being poor value for money. Certainly when drawdown is promoted as offering 4% inflation-linked income then annuities seem exceptionally bad value for money when a joint inflation-linked annuity for a 65-year-old couple with 100% survivor benefit will typically provide around £2400 annual income from a £100k purchase.
However, it is impossible for the private investor to reproduce the characteristics of an annuity due to insurers benefiting from mortality credits and investment efficiencies. If the average lifespan of an annuity purchaser is until say age 85 then because of pooled risks the company only has to plan for this average age. 50% of clients will die earlier and the 50% living longer are subsidised by those who die younger. An individual retiree trying to ensure a lifelong guaranteed income cannot plan for the average and must plan for the maximum life span. An individual investor would also have to use the same category of investments as an insurance company but without access to the company´s purchasing power, expertise, and the ability to hold bonds to their redemption dates (which minimises potential capital losses).
The comparison of an annuity with the 4% from income drawdown may well be dubious as the experts predict that this drawdown level is unlikely to be realistic in the future, certainly doesn´t apply in the UK and the reality is fear of running out of money results in retirees drawing down far less than is theoretically possible. I´ll look at these issues in more depth a bit later on.
Are Annuities´ Reputation for High Expenses Justified?
There is no Upside With An Annuity
- Market performance
- The general economic environment, in particular, price inflation
- Investor behavior – theoretical investment returns are not achieved as fear causes retirees to deviate from the investment strategy
- Longevity
An inflation-linked annuity is immune to all 4 risks and a fixed annuity to 3 or the 4. Annuity income may permit less income to be taken from other assets so increasing any potential legacy. But perhaps the greatest upside is that retirees will have a greater income during the first decade of retirement when it can be appreciated most.
Is The Comparison with the 4% Drawdown Rule Valid?
- High valuations (USA) with the Shiller CAPE10 indicating a market peak
- Low Bond Yields – a predictor of future bond returns
- Low bond yields indicating lower equity returns as equity returns trend towards bond yield + a risk premium.
- The tendency for markets to return to historic averages – meaning higher bond yields and lower equity returns.
A Fixed Annuity is Often Closer to Real Retirement Spending Patterns
Go-Go
Slow-Go
No-Go
The Inflation Risk
The 5.5% inflation rate used in the charts earlier probably seems excessive compared to recent history. However, there are probably many of us who remember the 1970s and early 80´s when inflation would have had a shocking impact on anyone relying on a fixed income.
We are all familiar with the concept of sequence of return risk in respect to portfolio market returns. We don´t tend to think of inflation in a similar way although it can be equally devastating. The graph below shows the average annual inflation over the previous 30 years on a rolling basis. So a retiree in his 30th year of retirement in 2020 would have experienced annual inflation of 2.7% since his retirement in 1990 and a retiree completing his 30 years in the year 2000 would have suffered 7.9% annual inflation.
Partial Annuitisation
What Proportion to Have in a Level Annuity?
- Wade Pfau recommends replacing all of your bond holdings with lifetime annuities (“Why Bond Funds Don´t Belong in Retirement Portfolios”) considering that an annuity may be considered as a bond but with no return of capital.
- Others suggest that you assess your minimum necessary income and ensure this is fulfilled with guaranteed income products such as the state pension, secure workplace pensions, and annuities.
- In a Morningstar podcast “How to Lower Retirement Risk at a Turbulent Time” retirement researcher Professor Moshe Milevsky recommends that you value all your retirement assets, capitalising income such as the state pension, and if the % dedicated to guaranteed income is more than 70% then don´t annuitise. He advises that guaranteed products such as pensions should represent between 20% and 70% of the total value depending upon personal circumstances and risk tolerance. So for example a couple with a joint state pension of £9,000 p.a. and a retirement portfolio of £500,000 would capitalise the state pension at its equivalent annuity cost of £300,000 giving a total asset valuation of £800,000 of which guaranteed income represents 37.5% – more than his recommended minimum of 20% but less than his upper limit of 70% (£560,000).
A Practical Example:-
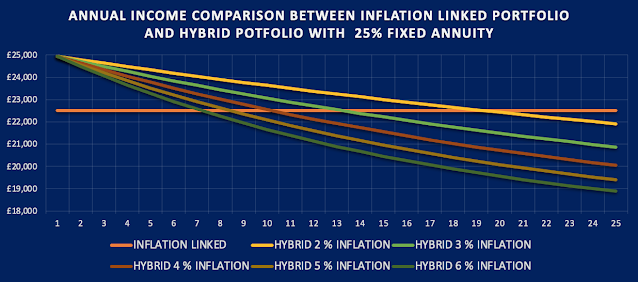
- 25% of £750,000 (£187,500) for level annuity paying 4.3% for joint life 100% survivor benefit. Annual level income of £8062.
- Balance of pension pot £262,500 (£450,000 less £187,500) in drawdown with annual inflation linking at an initial 3%. Annual inflation-linked income £7875.
- Inflation-linked state pension £9000
A few comments:-
- The greater the proportion of level annuity the higher the initial income but the minimum income safety net is reduced. A high element of level annuity works well in low inflation environments but exposes the retiree to greater inflation risk.
- A 3% initial drawdown rate is assumed which is certainly safe on a historical basis but it has to be accepted that it is not risk-free. To play safe a retiree could allocate some of the drawdown element to an inflation-linked annuity. This could work well for a single retiree as the annuity rate would be the same as the drawdown rate at around 3%. It could even work for a couple if it were possible for the partner who had the great possibility of living longest to make the purchase.
- It has been assumed that the annuity is purchased from a pension fund such as a SIPP. Some retirees may be reluctant to do this as they will be losing the attractive inheritance tax benefits of a SIPP. The alternative, a purchased life annuity that can be bought with non-pension funds and is taxed at a lower rate (around 13% of the income is taxable as a proportion of the income is treated as a return of capital). However, certainly in the UK there is limited competition in the marketplace and rates are significantly inferior to those offered by a pension annuity.
Conclusions
- A higher level of income during the first decade or so of retirement
- A reduction in sequence of return risk
- A higher total real income during the first 2 decades or more of retirement
- An increase in guaranteed income that encourages greater spending
- Protection against long term poor market performance
- Loss of SIPP inheritance tax concessions
- Potential for a reduced legacy
- Preoccupation about higher future annuity yields
- Worry about a return to 1970s levels of inflation


This comment has been removed by the author.
Yet my assets tied up as capital (=house) rather than such a large pension pot. What then?
Downsizing must come into play – then use the capital as a deferred injection into an annuity..? Is that possible? This means I'll get a better rate (as older).
I´ve never understood why downsizing isn´t a more popular strategy – far more emphasis is given to equity release. I have a far bigger house than I need, I appreciate the space and have an Airbnb side hustle that covers all house-related expenses. However, if the day comes when I don´t want the hassle or need some capital I´ll happily downsize. Certainly in the UK house ownership is tax-efficient (no CGT) and easy and cheap to leverage plus it can provide a higher quality of life and if it can also fund your retirement what's not to love?
Hi guys, I am trying to find some form of spending by age data, on which to model my future drawings.
For the UK, I see data suggesting that an 80 yo's spend is c. 67% of a 60 yo. That reasonable? How to profile spend vs. age?? What is a good source of data? The data I see is in rather course bands (5 or 10 yr) and often stops at 75. Hm.
Clearly, getting this right will avoid future disappointment / allow increase reasonable early retirement spending!
This article about retirement spending makes interesting reading:-
https://ilcuk.org.uk/wp-content/uploads/2018/10/Understanding-Retirement-Journeys.pdf
It shows that virtually all categories of retirees reduce their spending with age and that all including the "just making do" retirees actually end up spending less than their income and that in general retirees are net savers.
Thanks Max… following the spending profiles in this doc I've decided I can down-rate my spend in older age and spread that ££ over the 1st 10 years. Nearly 1/3rd extra available in the early years now! A great & useful uplift! 🙂
I use the solver in LibreOffice to juggle the yearly split between savings and drawdown by year and anticipated fund growth (I'm using 2% over inflation as a long-term average) and that can skew the mixes however I want, so to maximise whatever I want. Given a particular scenario, I can explore options. Some things make almost no difference and some quite a bit. Minimising drawdown to minimise taxation is less important then deferring early drawdown; the extra in the main pot adds more growth then the later, greater loss due to funding the tax from the pension pot.
How do you approach planning the drawdown strategy – the consumption side, rather then the fund yield side? Is there an article on that?
Thanks agn!
I´ve really only briefly touched on the subject of retirement spending patterns – maybe I´ll write more in-depth in the future. Certainly in the UK so much depends on your individual financial situation as the greatest financial risk must be long-term care. This is likely to financially hit medium earners far more than a retiree "just getting by" and the really well off will take the costs in their stride. I concluded that, certainly for me, it was not worth trying to provide for this potential cost – and who knows what the rules will be in 20 years' time. Once you eliminate this potential hit then the combination of a level annuity with inflation-linked sources of income can provide a pretty good approximation to average spending characteristics – a higher income during the first 10 years or so then an income that declines by 0.5% to 1% in real terms.
Q re tax and nursing (care) homes. In UK, I understand these bodies can access pension pots directly. If so, is their take (likely very high pa!) taxed?
A very good point. We need to wait to see what the UK government proposes for social care funding. There are a number of ways to currently protect assets including trusts and annuities. Certainly, this, IHT and the whole issue of coping with mental incapacity must form part of a long-term plan and is an area where professional advice is well worth the expense.