The March 2024 UK budget proposed a British ISA allowing an extra £5000 per year to be invested in UK equities resulting in a fair amount of criticism saying that the government was encouraging investors to become UK overweight against the advice of most professionals. If the basic £20k ISA was invested in global securities and the £5k in the UK the investor would have a 20% UK weighting whereas the UK represents about 4% of the global stock market. Financial theory based upon the Capital Asset Pricing Model (CAPM) leads to the advice that investors should hold a total world market capital-weighted portfolio such as that represented by a FTSE or MSCI World Index. Having a 20% UK weighting is contrary to recommended good practice.
The CAPM makes Some Idealised Assumptions
- That markets are competitive, efficient and that company information is widely known
- Investors are sophisticated and well-informed
If these assumptions are correct then the market that comprises millions of investors and analysts will determine the correct price for a security based on everything that is known about that company and the economic environment. In theory, there are no underpriced or overvalued securities so it should be impossible for a fund manager to outperform the market – at least in the long term. This is borne out in practice with virtually no fund manager beating the market over 15 to 20 years.
Of course, the CAPM is a very idealised view. The market certainly has periods of irrationality often fueled by herd instinct. Benjamin Graham accurately described the market:-
“In the short run, the market is a voting machine, but in the long run, it is a weighing machine.”
So there will be periods when the market is under or overvalued short term due to irrationality but eventually, the market trend towards valuations that reflect economic realities.
The concept of owning all of the market is best seen by taking the example of shares in three companies in the same sector. The investor has to choose which of the three in which to invest. Unless he has some inside knowledge then it is a guessing game as the share price should reflect all company and market knowledge. So he has a one in three-chance of picking the winner – not very good odds. If however, he invests in all three companies he minimises his risk and will achieve a return equal to the average performance of the three. So the investor sacrifices the small chance of a big win for a guaranteed chance of some kind of win. This is the reason the recommendation is to own the whole market. In a cap-weighted index (the majority) the poor performers will see a long-term decline in their valuation leading to the index reducing their holding and the winners achieving a higher weighting in the index.
Diversification
Global index funds that can hold shares in over 7000 companies are often promoted as offering investors low-cost diversification. The dominance of the Magnificent Seven tech companies has disproved this belief. Cap weighting results in the indices being dominated by giant companies in developed markets. A good example of this is to compare the performance of the S&P 500 Index with the US Total Market Index which has over 3500 constituents. Over the last 50 years, the S&P had a compound growth rate of 10.62% and the Total US Stock market 10.61%. Because of this lack of diversification, there is more interest in equal-weighted indices, although so far these are limited to the S&P 500 Index.
Factors Favouring Home Bias
The theory says you should invest globally by the weighting of each market, but in practice, few private investors follow this dogma. In a recent radio interview following the budget proposal for a UK ISA the Managing Director of AJ Bell said that the majority of its private investors had more than 50% of their holding in UK companies and that the proposed ISA would make little difference to these weightings. There are various factors that the CAPM model doesn`t take into account that favour some level of home bias:-
- Fund fees – funds and ETFs in overseas shares usually have higher fees than a UK Index Tracker. Most Global Index Trackers have fees in the range 0.15% to 0.23%. UK FTSA Index trackers have fees of 50% of these.
- Taxation – the overseas holdings of funds and ETFs can be subject to foreign withholding taxes.
- Risk – foreign governments can nationalise companies or expropriate assets. In 1938 the government of Mexico expropriated the assets of all foreign oil companies operating in Mexico. Venezuela under President Chavez purchased at below-market rates shares in overseas power companies and took control of various oil projects. The Russian-Ukraine war has led to foreign companies in Russia having to divest their assets at knockdown prices.
- Currency Risk – Overseas investment has from an overseas stock valuation viewpoint been beneficial for UK investors due to sterling weakness. No one can predict the future and currency fluctuations add volatility and potential risk to overseas investments.
- Inflation Hedge – Companies serving a local market will adjust their prices in their response to inflation and provide local investors with some level of inflation protection.
- Legislative protection – governments will protect their local companies to the benefit of local investors and at times against the interests of foreign companies through the imposition of import quotas, tariffs, subsidies, and sales restrictions. The US attack on Chinese companies and the promotion of onshoring are good examples of this.
How does the UK Content of a Portfolio Impact Drawdown Safe Withdrawal Rates??
Some time ago as an experiment, I simulated increasing the UK content of my 65/35% equity/bond portfolio using Timeline`s simulation tools. I was very surprised that adding 20% UK to the global portfolio improved drawdown performance. At the time I thought it was an anomaly of the Timeline database. More recently I undertook a similar simulation using the simulation tools on portfoliocharts.com and again there was a performance improvement. These results surprised me so I have undertaken a more detailed analysis using both simulation tools.
Using Timeline historical analysis mode (rather than Monte Carlo) I looked at a 100% equity portfolio with a 4.5% drawdown rate to stress the portfolio and a 30-year retirement period. To a global index portfolio I then added more UK content in 10% increments – but bear in mind that the global index has around 4% UK content – so adding say 20% extra UK gives a total of 24% UK. The effects on success rate and final legacy are shown below:-
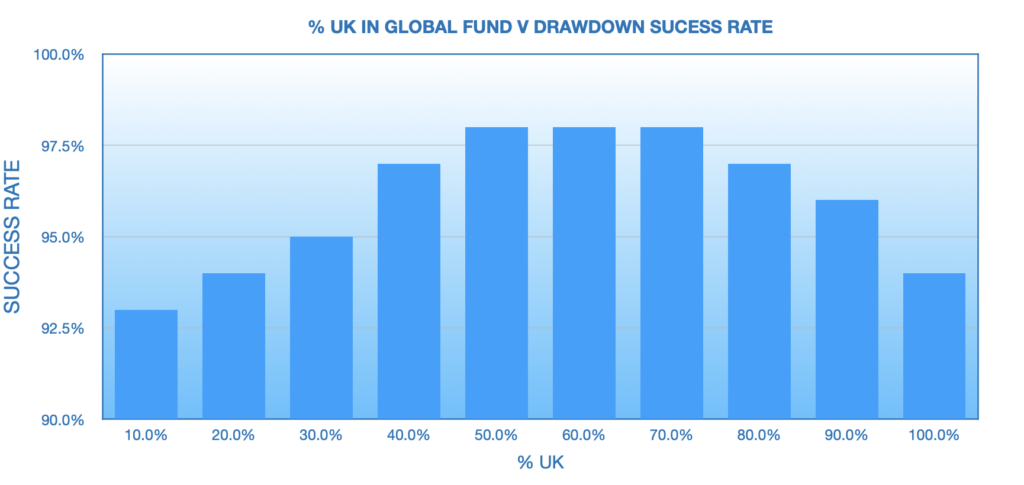
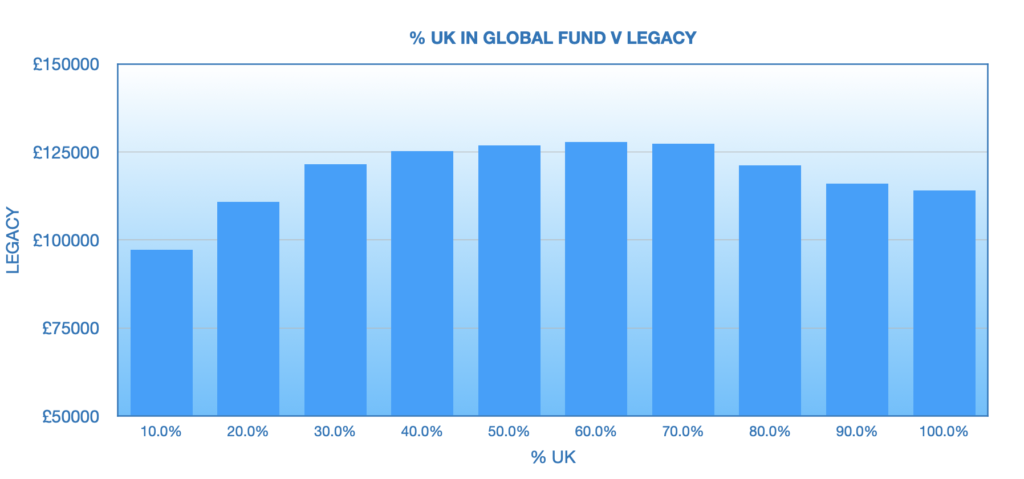 Surprisingly having 50% or so UK content boosts the success rate and the final legacy.
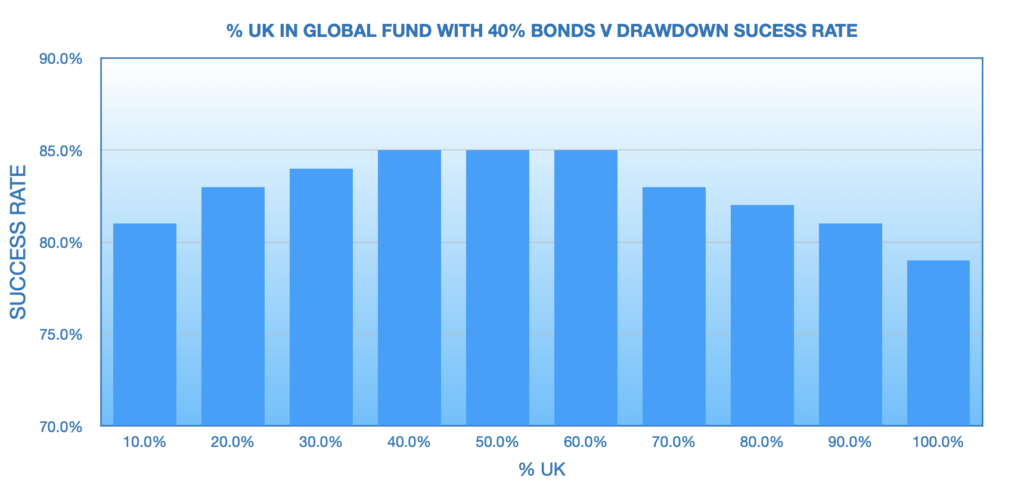
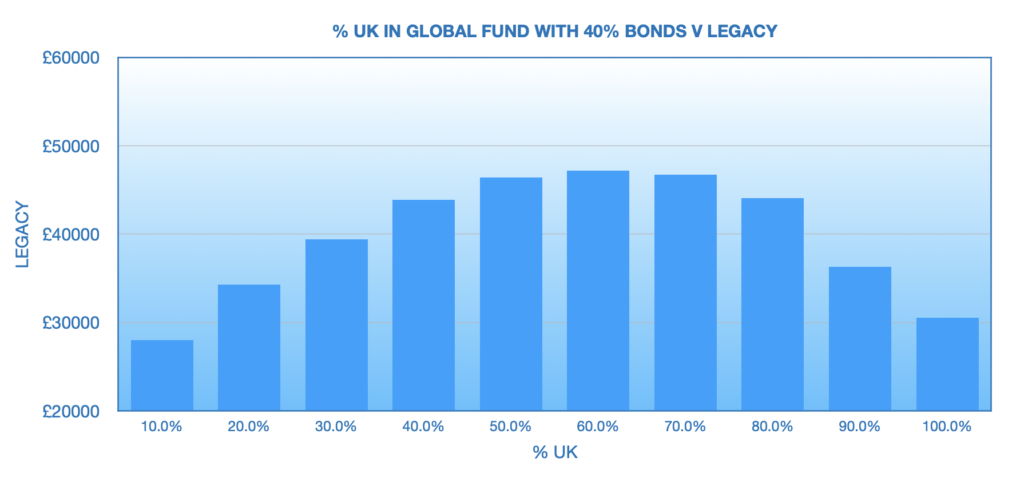
The same analysis but with 40% in global bonds:-
Analysis Using Tools From Portfolio Charts
Portfolio Charts offers a range of free tools and a far more extended range on a paid basis. The approach is very different from that of Timeline which is 100% geared to the UK investor. Portfolio Charts allow the user to choose his country of residence but apart from the US only offers the user a choice of local 10-year bonds, cash, and large-cap blend local stocks. These can be mixed with a comprehensive range of US bonds and equities, Europe, Emerging Markets, and World Markets (ex-US) plus gold and commodities. The user can select a variety of different analyses such as SWR, drawdowns, portfolio growth etc.. The free version is far more laborious as the user has to set up data for each parameter he wishes to view whereas in the paid version after entering the portfolio data he will have immediate access to 19 different graphs. The image below shows the portfolio configuration screen for a UK investor:-
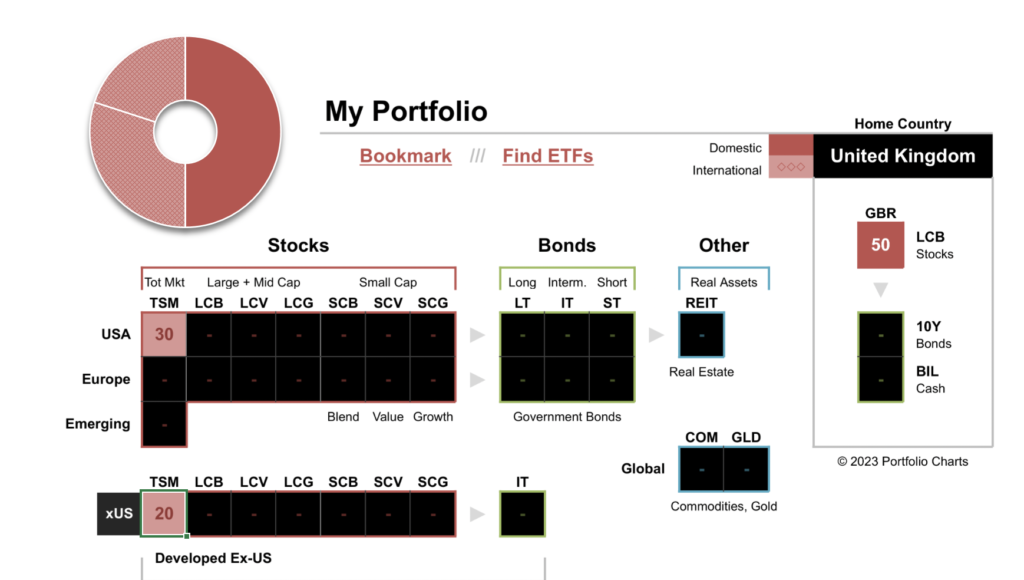
Compared with Timeline there is a different range of assets available and history going back to 1970 whereas Timeline has databases going far further back. Direct comparisons are therefore not possible but it is still useful to see the impact of UK home bias on performance. The effect of increasing UK weighting on the Safe Withdrawal Rate for a 30-year retirement is shown in the graph below:-
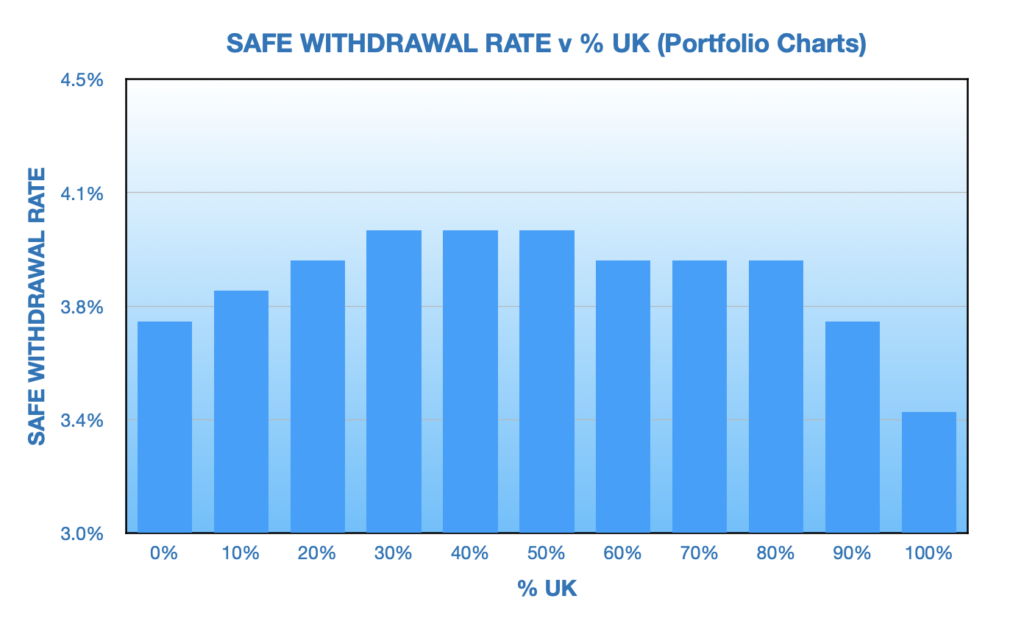
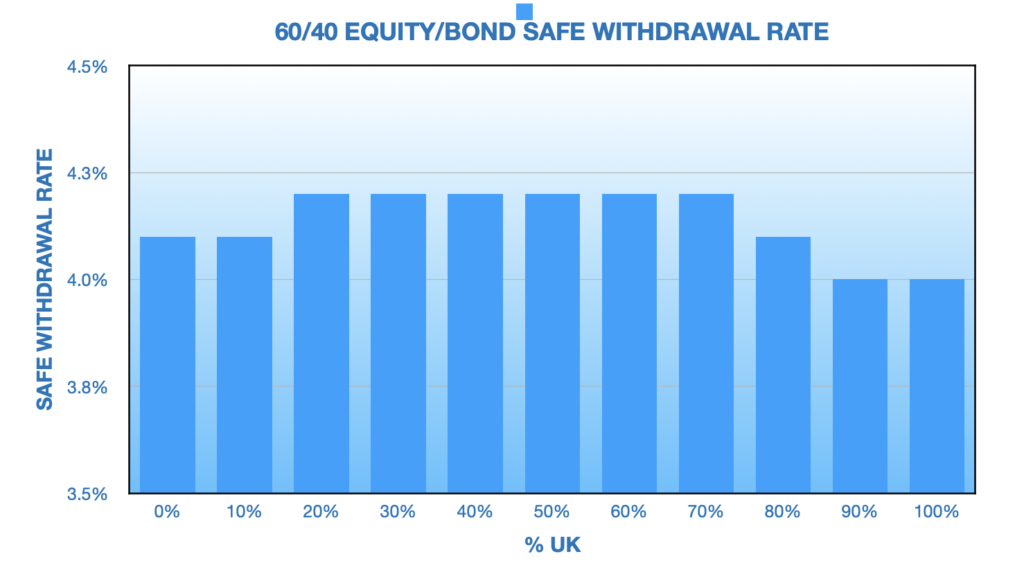
The maximum SWR is achieved with a UK content of between 30% and 60% compared to 40% to 60% with Timeline`s simulation. A 60/40 equity/10-year gilt portfolio gives the results below:-
CONCLUSIONS
Most investors seeing these results will have a high degree of skepticism. Not only because home bias goes against conventional investment advice but because the UK stock market has underperformed global markets significantly over the last decade. Whilst the FTSE All Share total return has returned 70% over the last 10 years, the global indices have returned around 200%.
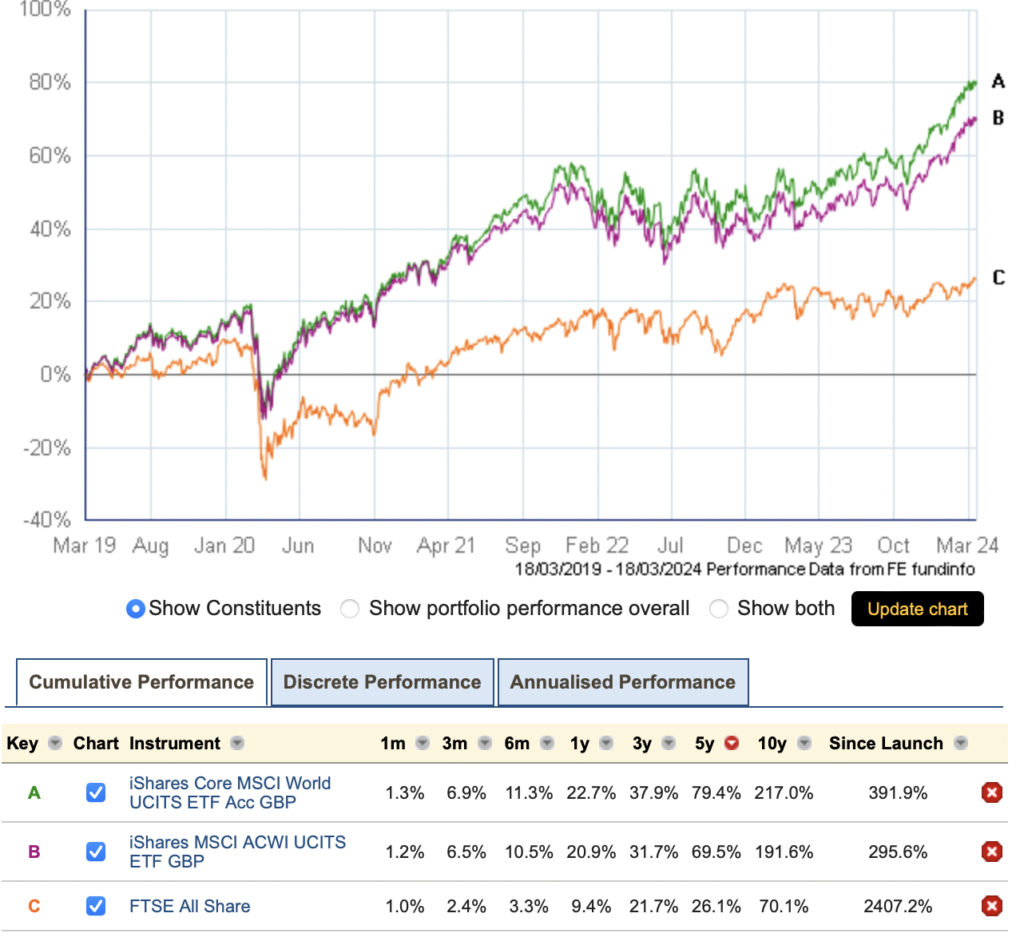
This disconnect between market underperformance and potential retirement income is not explained by the addition of UK equities to a portfolio reducing its volatility. The maximum fall in value (drawdown) of a portfolio increased with more UK content. Of course, these analyses are based on long-term data, 50+ years not on the last decade. Also, the current low valuations of the UK stock market should lead to improved medium to long-term returns and it should be remembered that the performance of the US market over the last 50 years with a 7% real return is considered exceptional, and current valuations indicate a 3% future real return which will bring the US back to its historic trend return of 5%. This could lead the UK to outperform the US.
This analysis won’t lead me to change my current asset allocation but it also doesn`t do much to support the view that home bias is a cardinan sin. It certainly doesn`t appear that a small amount of home bias will detract from portfolio performance and may even improve it and that obsessive avoidance of UK bias is probably unjustified.


