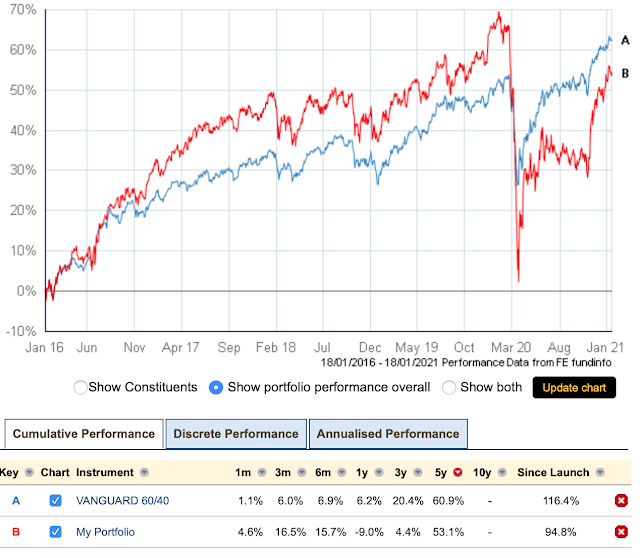
I´ve just completed my annual review of the Investment Trust Income portfolio and was pleased that income held up well in 2020 with no reduction in payouts, but unsurprisingly a decline in the portfolio value of around 11%.
Out of pure interest, I did an analysis of the performance over 5 years of the IT Income portfolio compared with drawing down an identical income from Vanguard´s 60% Equity LifeStrategy Accumulation fund.
In view of the UK bias of the IT portfolio and the relatively poor performance of Income Investment Trusts I was very surprised to discover that the Investment Trust Retirement Income portfolio would have been the winner – only ahead by 1.5% but even so, this confounded my expectations.
An investment 5 years ago of £100K in both the IT portfolio and LifeStrategy 60% Equity would have produced £29.9K of dividends from the ITs over that period and if the same annual amount were drawn down from LifeStrategy on a monthly basis the investor would have seen his LifeStrategy investment increase to £119.9K and the Investment Trust Portfolio increase to £121.8K.
This 5-year comparison using a specific portfolio is no basis for an argument in favour of dividend investing but I did want to comment on an outcome that defied my expectations.
The Investment Trust Income Portfolio
A lot of research went into selecting the trusts, in particular, I was interested in their post-2008 crash dividend performance, but their relative weightings are fairly haphazard as the portfolio was formed by merging two portfolios held on different platforms where there was some duplication of holdings. The portfolio yields 5.1% and has a couple of changes compared with the portfolio posted in April 2020 (Investment Trust Income Portfolio. In 2016 the income received was £6200 and this grew by 2.8% p.a. compared to a compound c.p.i. rate of 1.8%. The future outlook for dividends doesn´t look so rosy but only time will tell.
Comparison With Vanguard LifeStrategy 60% Equity (income reinvested)
Until the crash of March 2020, the Investment Trust Portfolio outperformed Vanguard´s Life Strategy 60% fund. When the crash occurred the 40% bond holding of LifeStrategy came into play allowing it to grow by 6.2% in 2020 compared to a 9% fall in the value of the Investment Trust Portfolio. Over 5 years LifeStrategy outperformed the IT portfolio by over 7%.
The outperformance of the IT portfolio during the good times compared to an equity/bond portfolio is to be expected so too is the downturn protection provided by the bond holding in the LifeStrategy fund. As ever the investor has to trade performance against volatility.
Dividend Income versus LifeStrategy Drawdown
I have assumed an investment of £100k on January 1st 2016 in the Investment Trust Income portfolio and in Vanguard´s 60% Equity Life Strategy (accumulation units). IT dividend portfolio would have generated dividend income of:-
The drawdown of LifeStrategy is monthly, so in 2016 this represents £5495/12 per month, 2017 £5712/12 month, etc. The graph below shows the monthly LifeStrategy valuation. After the first month’s drawdown at no point over the 5 years is the balance below the initial £100k investment.
Are There Lessons to be Learnt
The end result over 5 years makes the IT portfolio a winner by a nose when identical incomes are taken.
The Investment Trust investor has to tolerate high levels of volatility in portfolio valuation – a maximum drawdown of around 55% compared with 13% or so from LifeStrategy. Many retirees would opt for the LifeStrategy drawdown route as it has the capability of providing the same income, the same long term return, and much less volatility – so far fewer sleepless nights.
The IT Income Retiree Can Enjoy a Higher Initial Income
In order to provide the same level of income as the Investment Trust Income Portfolio, the drawdown investor would have to have started the five years with an initial drawdown rate of 5.5%. This is a far higher initial drawdown rate that most investors would be happy with and although in the case examined this would have been perfectly safe most retirees are generally more conservative starting off at 3.5% to 4%.
Compared with a dividend income of £29.9k over the 5 years the drawdown retiree would receive £20,733 at a 4% initial rate and £18,140 at an initial 3.5% (increasing annually by the rate of inflation). Of course, the value of his investment after 5 years would be much greater but he would have received between 33% and 40% less income.
Conclusion
In the case examined there are trade-offs in both the IT Income approach and drawdown. The IT Income retiree can take a higher initial income but at the cost of far greater volatility. The drawdown retiree has the dilemma of choosing an initial drawdown rate and if he errs on the side of safety will receive a lower income than the IT Income retiree but will suffer far lower volatility and enjoy greater capital appreciation.


