It`s time for the annual review of my Investment Trust Income portfolio.  Because these are actively managed trusts a periodic review is essential because managers change, philosophies change and sometimes managers go somewhat off the rails!  Also, trusts that are Dividend Heroes sometimes struggle to maintain their multi-annual records of dividend increases.  This can deplete their reserves to such an extent that the level of future increases is threatened.
It has to be accepted that a Dividend Income portfolio is never going to be a set-up and forget investment strategy.  However, a third of my retirement portfolio is invested in an Investment Trust Income portfolio sheltered within an ISA.  Whilst I still have the enthusiasm and mental capacity this strategy split between dividend income and total return income drawdown suits me well.
Dividend investing is not generally favoured with Total Return investing being promoted by the “experts” as a better investment strategy and in previous posts I`ve examined the pros and cons of dividend investing in general and the advantages of Investment Trusts as opposed to funds, ETFs, and individual shares in providing inflation-beating retirement income:-
I accept many of the arguments against “living off dividends”  but I am certain that for some UK retirees an Investment Trust Income portfolio can form a useful part of their income strategy.   Personally, I find it reassuring to have a regular income pretty well independent of market ups and downs, with a yield higher than could be obtained through drawdown and from a portfolio where on average dividends have grown at inflation-plus levels even during the Covid dividend turmoil of 2020.

It´s Pretty Well Impossible to Have a Passive Dividend Income Strategy

If you are looking to produce an increasing stream of dividend income then passive/index investing fails to meet this objective. Yes, there are various index-type income products such as the Dividend Aristocrats and high dividend yield indices that can be accessed via ETFs or funds.  However, none of these produce income stability – just look at the decline in dividends of the income funds post march 2020.  Investment Trusts, however, are able to smooth out their dividend payments by holding back some income in reserve during the good years and accessing these reserves during difficult times.
Of course, this is no free lunch.  An income investor holding funds or ETFs would enjoy higher payouts during the good times and an investor could create his own cash buffer for when times get bad.  However, being inherently lazy I prefer to leave this dividend smoothing to someone else and Investment Trusts perform this role very efficiently.
This ability of the trust´s manager to retain up to 15% of earnings during good times is a significant advantage over funds and ETFs.

You Have to Actively Manage an Investment Trust Income Portfolio

Why is Active Portfolio Management Essential?  Investment trusts change managers, managers change philosophies (remember Invesco´s Woodford/Barnet), investment strategies fall out of favour, trusts are taken over or merged (e.g. Temple Bar) whole sectors underperform (UK property, the UK market …) so the investor must undertake a periodic review – perhaps not annually but certainly every 2 to 3 years to check that the constituents of the portfolio are performing acceptably and that there have not been nor are there planned any changes in the objectives of the trust.
The need to actively manage an Investment Trust portfolio is probably the greatest drawback of this income strategy.  It takes me about a day to review the IT market and draw up a short list of the best-performing trusts and compare this with my own holdings.  I am very reluctant to make changes to my portfolio but occasionally I have to. In the latter years of retirement, a retiree may not have the desire or mental ability to deal with investment issues. So an Investment Trust Income approach may not be ideal for the first decade or so of retirement and changing to draw down on a total return passive Index Tracker portfolio could well be a safer strategy.

Methodology

 I am looking for trusts that:-

      • Pay a dividend yield at least as high as a typical drawdown Safe Withdrawal Rate (SWR)
      • Have demonstrated a strong commitment to increasing or at the very least maintaining dividends
      • Have beaten the FTSE All Share Total Return over 5 to 10 years
      • Pay dividends predominately from revenue, not capital
      • Ideally, they should have the equivalent of at least one year of dividends in revenue reserves

One year plus of dividend cover is currently a rarity as whilst strong market returns had allowed most trusts to build up their reserves post 2018 crash, most had to dip into their reserves in 2020 in order to maintain their dividend payouts when a high proportion of UK companies were forced to cancel their dividends.   For instance,   the reserves of The City of London Investment Trust which have increased dividends for the last 56 years have fallen to around just 5 months’ cover.

The First Cut:-
My first port of call is always the Association of Investment Companies  (AIC) which is the trade association for the Investment Trust Industry and provides a valuable resource for the IT investor.  In addition to company data, it has a useful tool where you can simulate your portfolio and check the current and historical dividend payouts.  Trustnet can provide an even more detailed analysis of the proposed portfolio, with powerful charting tools to allow comparisons of the portfolio against indices, alternative portfolios, funds, ITs, and ETFs.
The Dividend Heroes list on the AIC site makes a good starting point for developing a shortlist of Income Investment Trusts.  The list is in two parts, companies that have increased dividends continuously for more than 20 years and those that have increased them for at least 10 years.  It should be noted that if a company just maintains its previous year’s payout this will break its track record of increasing payouts – in a low inflation environment or during a dividend crisis such as in 2020 some investors would be happy to accept income stability and wouldn´t exclude such a company from consideration.   For instance, although Law Debenture is shown as having only an 11-year dividend increasing track record it has in fact never decreased its payout in over 42 years.
Unfortunately for the dividend investor some of the companies denoted as heroes are not so heroic at providing income!  Of the 44 companies in the table, 19 have yields of less than 3% and one (Scottish Mortgage) has a yield of only 0.3%.   In fact, the AIC avoids publishing the yield in the table so the investor has to do a little bit of work to pull all of the data together.
In the table below I have added the dividend yield.  This is very much a starting point for analysis and when a final shortlist is produced it’s essential to dive deeper into the data.  Fortunately IT data is far more accessible than funds and ETFs as the published annual accounts of the IT companies provide a wealth of historical data and in most cases, it is possible to extract a 20-year-plus history of dividends from their published annual accounts.
I like to ensure that dividends are paid from revenue (dividend income) rather than capital (share sales) and the published annual accounts are useful to identify any proposed changes in investment or dividend strategy. The historical level of dividends is also important as there are companies that for years paid out very low but increasing dividends and then changed to a more generous payout resulting in an excellent dividend increasing track record but one where the yield would have been too low for many years for a dividend investor. So care and a degree of skepticism is necessary but the table is a good starting point from which a shortlist can be created and the companies researched in greater depth.
It should be noted that property and infrastructure trusts generally have minimal dividend cover.

Selection Criteria

I put all the companies in a spreadsheet and add the following data for each company:-
            • 5 Year Dividend Growth
            • Dividend Cover (years)
            • Total Assets
            • 5-year Total Return
Then I apply the following selection criteria:-
  • Minimum Yield 3.5% – roughly the safe withdrawal rate (SWR) of a drawdown portfolio
  • Assets > £100m.  Small Investment Trusts are vulnerable to mergers and closures and will not attract the best managers.
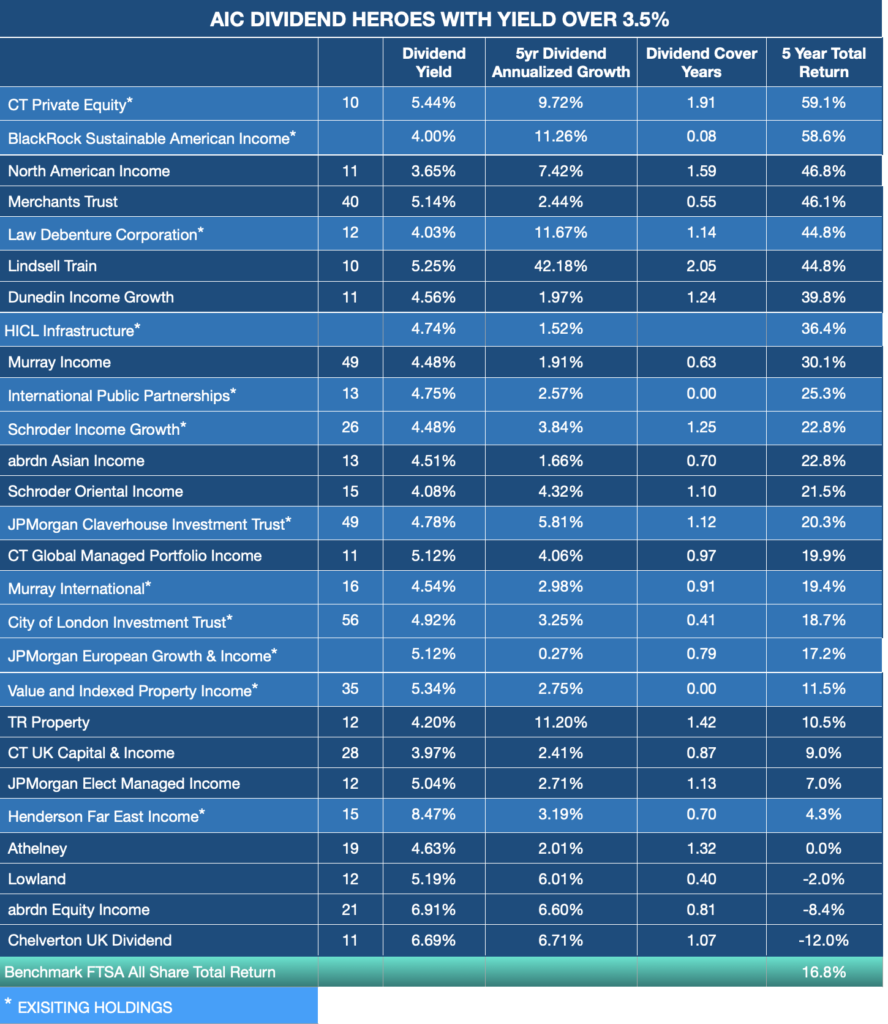
The table below shows the companies that have passed the first selection test plus those companies that are in my current portfolio but could best be described as “fallen heroes”!  My portfolio holdings are shown in a lighter shade of blue and have an asterisk.  The table is sorted by 5-year total return

table of selected dividend heroes

The Final Cut

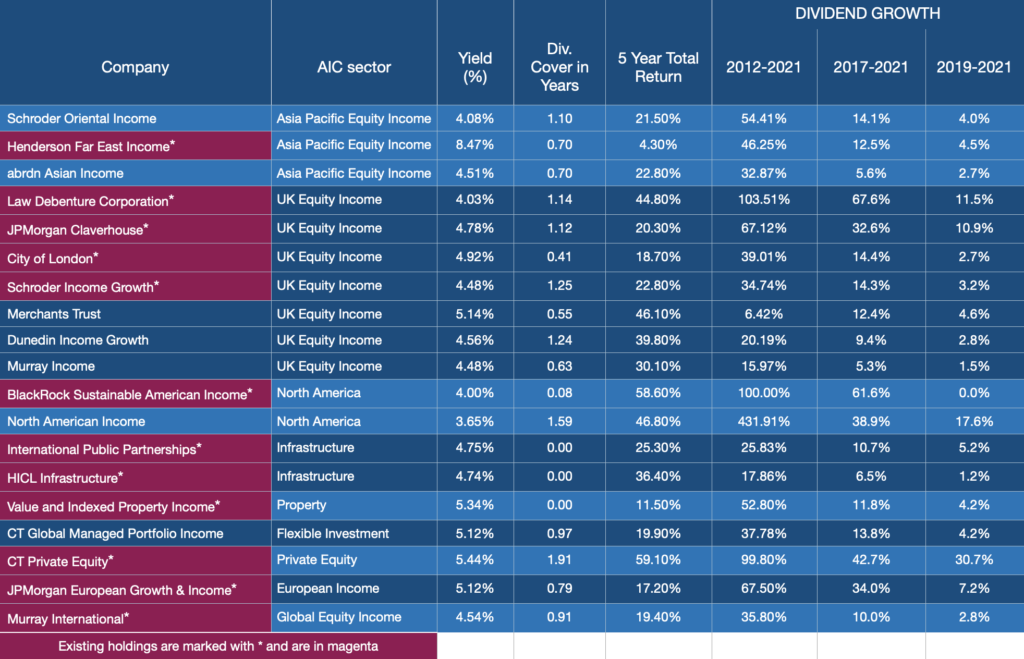
All companies that have not equaled or beaten the FTSE All Share total return over 5 years have been eliminated.  I have also excluded Linsell Train because with a 40%+ holding in its own management company I don`t feel it has a sufficiently diversified portfolio.  The table is grouped by sector and includes, yield, dividend cover, 5-year return, and dividend growth rate over 9, 4, and 3 years. The 2012 to 2021 dividend growth rate needs some care in interpreting because sometimes an exceptionally high growth rate may just reflect a change in the trust’s dividend philosophy.  The growth rate from 2019 to 2021 is interesting as it covers the 2020 Covid collapse in dividends and the ability of a trust to maintain or increase its dividend is a good indication of a trust’s commitment to dividends and the strength of its reserves.  Some trusts with depleted reserves such as City of London (dividend cover only 0.41) may have difficulty maintaining or increasing dividends in the future.  My own holdings are shown with an asterisk and magenta background.

table of income investment trusts


My principal aim with this annual review process is to examine the performance of my current holdings to see if they are underperforming their peers or if there are warning signs such as reduced dividend cover that raise a red flag that it is time for action.

Asia Pacific: Capital Growth or Income? This dilemma is highlighted when you look at the Asia Pacific sector.  The dividend yield of Henderson Far East is almost double its competitors at 8.47% yet the dividend growth is also strong compared to trusts in other sectors. But its 5-year total return was only 4.3% compared to the 20%+ of others in its sector.  The trust states in its annual report that this poor capital performance is due to its focus on value companies and that the shift from growth to value will improve its share price performance. The good news is that dividends are covered by revenue so there is no reason to think that its payouts are at risk unless there is a change in the trust`s objectives to focus more on total return.  So I will be sticking with the trust for the time being.

 UK Income: The biggest concern is the low dividend cover of City of London.  With 56 years of increasing dividends, it will be reluctant to ditch annual increases.  However, the 0.5% 2020 to 2021 dividend increase is probably an indication that the future is like to be miserly dividend uplifts. I am therefore switching my holding to be divided equally between Schroder Income Growth and JPMorgan Claverhouse.

North America.  BlackRock’s Sustainable American Income looks very shaky. Dividends have been frozen in Sterling terms since 2018 despite the decline of the Pound which should have boosted dollar-donominated dividend income. Reserves are negligible although dividends are covered by revenue.  Accepting a lower yield and swapping into abrdn`s North American Income looks like a better option.

Property.  Value and Indexed is transitioning from a 50% property, 50% UK equities to a 100% property trust.  The yield at 5.3% and the historic dividend increase rate are healthy but the 5-year performance is poor at 11.5% and well below the sector average of 40%+.  I give this trust an amber warning light.  It all depends on how their transformation pans out.

Other Sectors. No great worries except last year JPMorgan European merged their capital and income portfolios and now is aiming for a 4% yield on the previous year`s net asset value. If this is strictly followed then any market downtown will result in a dividend cut.  Unfortunately, there is no alternative European Income trust so it is likely that at some point I will have to exit the sector by switching into a global trust such as Murray International which is 25% or so in Europe

Revised Portfolio

The two changes are switching out of BlackRock Sustainable American Income and  City of London.  Both moves are due to the weak revenue reserves of both and the likely constraints this will impose upon future dividend growth. This does result in a reduction in portfolio yield from around 5.1% to 4.8% but an increase in dividend cover to a more healthy 1.16.  The table below shows the final £240K portfolio and the weighting of each trust:-

Table of revised investment trust portfolio


The portfolio has shown an annualised dividend growth rate from 2012 to 2021 of 4.9% compared to a CPI of 2.1% and a total dividend growth of 53% over the same period.
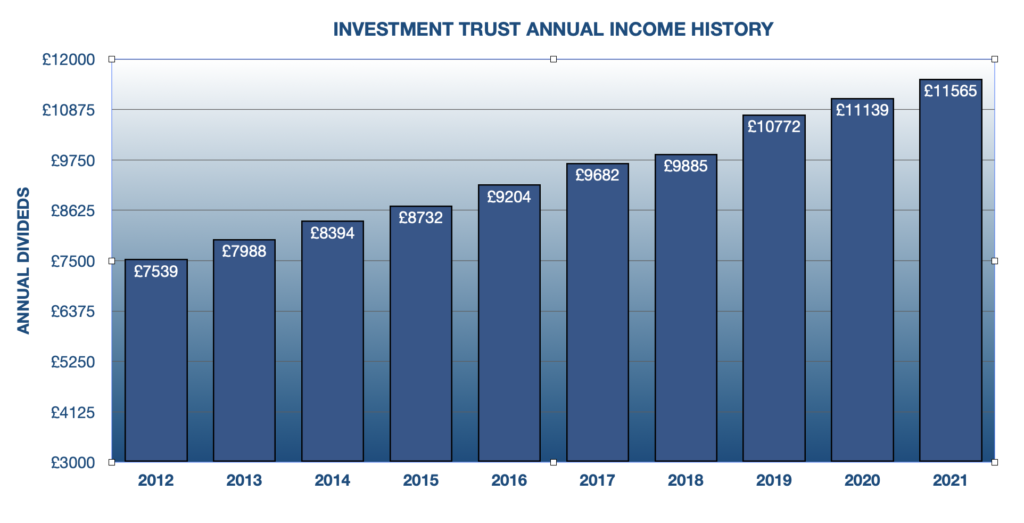
 

graph showing annual total dividends

The 10-year performance of the portfolio is shown below compared to Vanguard`s LifeStrategy 60% Equity which I have taken as a comparator as this fund would be popular in pension drawdown.  With a reinvestment of dividends the portfolio out-performs LifeStraegy over 10 years by around 50%.  Not surprising as it is 100% equity and not surprising also is its far greater volatility experiencing a worst-case fall of nearly 70% compared with about 25% for LifeStrategy.

With no re-investment of dividends which is the situation when relying on dividends for income, the situation is reversed with Vanguard out-performing by 70% over 10 years just confirming that living off dividends is no “free lunch”. Using Investment Trust Income as opposed to total return drawdown means having a very strong stomach to ride out the increased volatility and acknowledging that taking the dividends as income will reduce the capital.
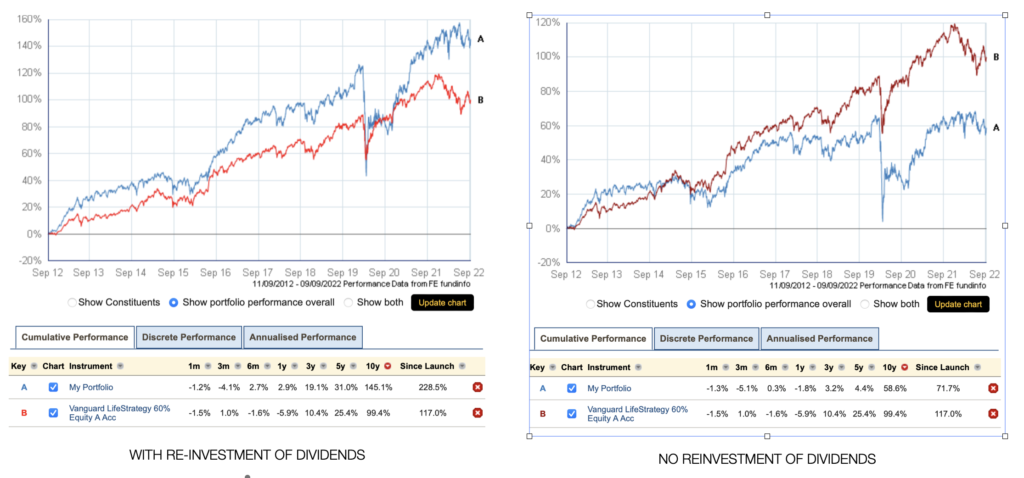
graph of investment trust 10 year performance

 This concludes my annual Investment Trust Income portfolio review.  Just two changes in order to boost eliminate those trusts at risk due to poor revenue reserves.  JPMorgan European and Value & Indexed are now on the watch list.  Overall it has been reassuring how Investment Trusts have weathered the 2020 Covid dividend crisis but it would be foolish to believe that dividends will be able to match the 10% or so inflation levels predicted for the UK.  It could well take 5 to 10 years before dividends have fully compensated for the inflation hit.

It’s difficult to know if the total return drawdown retiree would be in a much better position than the dividend income investor.  Theoretically, he can increase his drawdown income in line with inflation which puts him in a far better position than the dividend investor (in the current environment). However, I suspect that most drawdown retirees will take a far more conservative approach given the highly unfavorable combination of high inflation and declining stock markets.  Certainly, in the case of my drawdown portfolio where I use a Variable Drawdown strategy, it is probable that if I follow the rules I won`t be able to take any income increase next year unless markets improve.


Leave a Reply