

My instant answer to the question of which is a better investment property or the stock market would have been - the stock market has outperformed property over time but that the use of gearing to purchase houses has made property the better long-term bet. Now having done some research it is clear that the answer is not so clear cut.
Firstly its necessary to differentiate between buying a house to live in and buying a house(s) as an investment to rent out. Many years ago I remember the statement in the book ¨Rich Dad Poor Dad¨ by Robert Kiyosaki that you shouldn´t consider that the house you purchase to live is an investment - it is an expense to provide a roof over your head in the same way that a car is an expense to facilitate mobility. There are many perspectives to this issue - if one´s only objective in life is to make money then maybe any capital you have should be deployed to make money and therefore you should have the absolute minimum tied up in your own house.
However, for the majority of people who aren’t 100% dedicated to creating wealth a home kills two birds with one stone - comfort and security, and the opportunity to have an appreciating asset that later in life can be used to provide capital through downsizing, equity release, etc. Certainly in countries such as Germany and France renting throughout life is common but these are also countries that have very generous state pensions - around 90% of salary, so there is never the worry of a transition to retirement with significantly reduced and often insecure income with the worry of paying rent.
I belong to the camp that believes owning my own houses given me a sense of greater security and accumulation of capital than I could possibly have achieved had I rented all my life.
The question of property as opposed to the stock market as investments is more complex. When I first started to research this I came across this graph:-
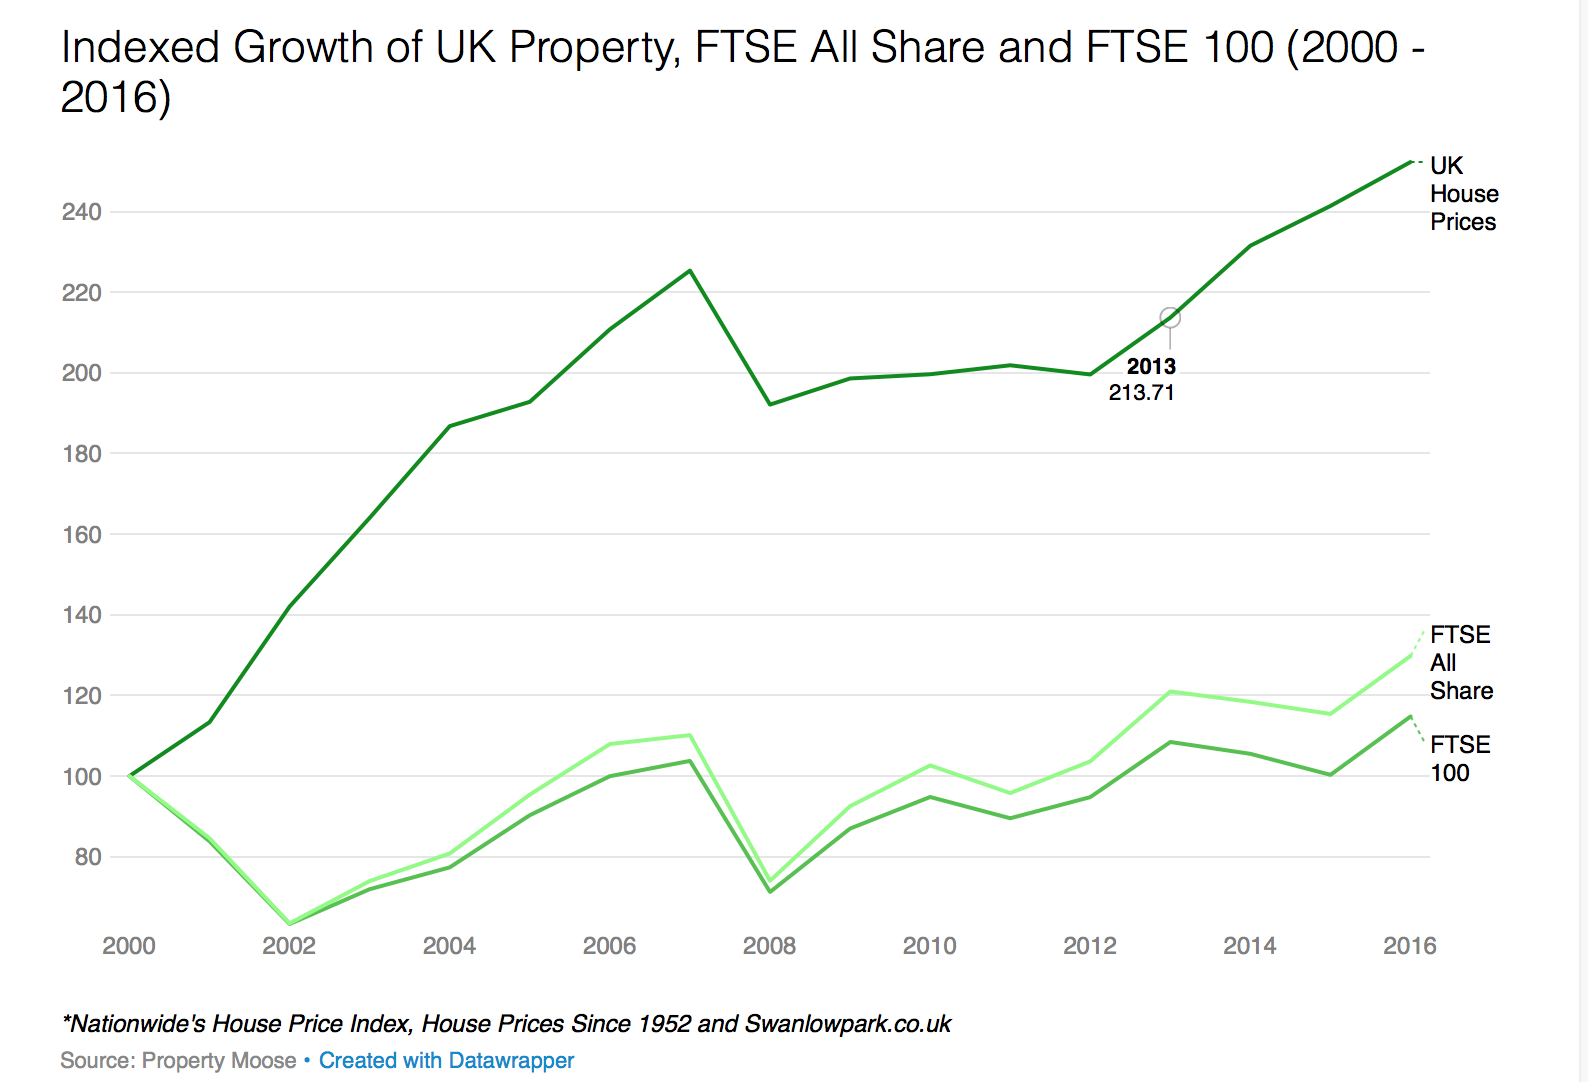
This graph shot down in flames my original perceptions! However, the source of the graph is the property investment crowdsourcing site Property Moose so the presentation is likely to be a little selective in the data presented so I decided to do a little more investigation as I well remember another graph from a few years ago showing the FTSE outperforming property.
It is instructive to look at the history of UK house prices and nationwide provides a valuable source of data going back to 1952.
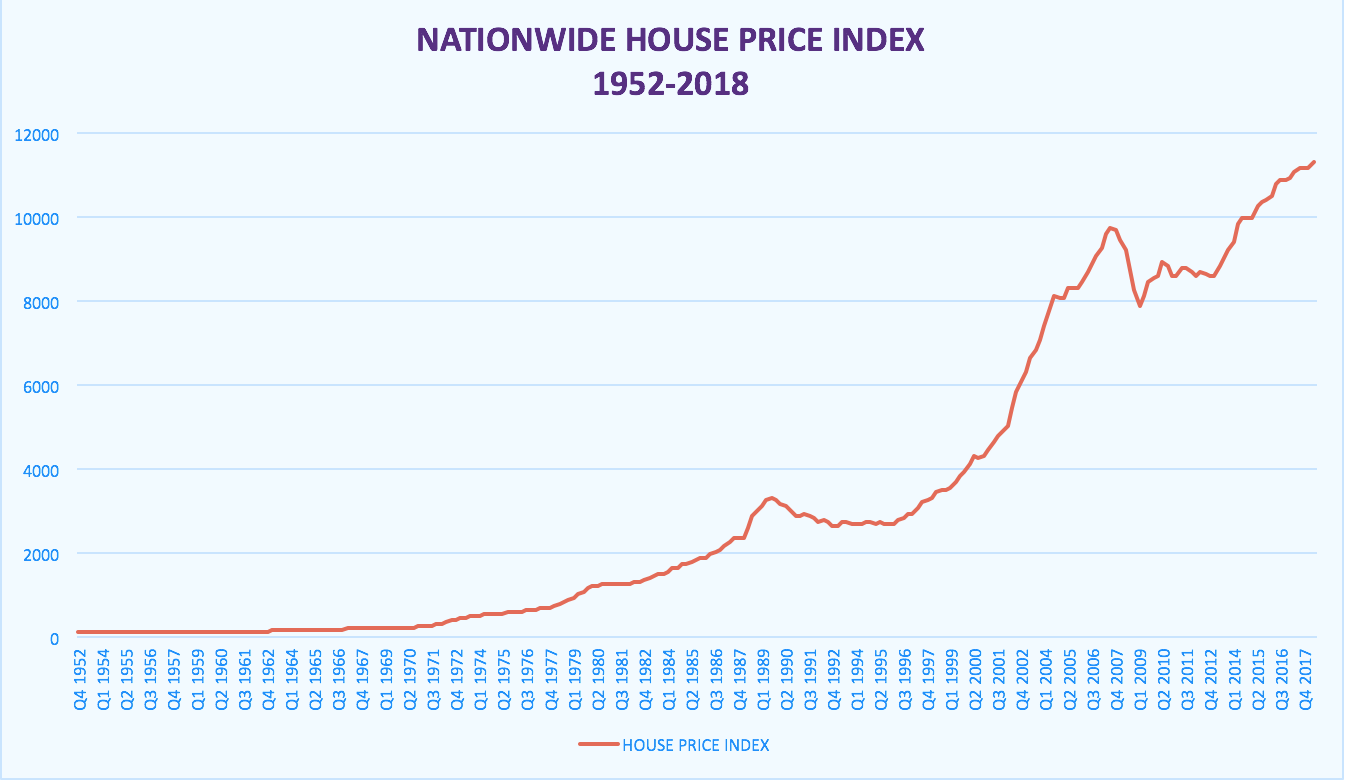
This shows an impressive r¡use in prices from an index base of 100 (average prices £1871) in 1952 to an index value of 11349 (£214,578) at the end of Q2 2018. This equates to a compound annualized growth rate of 7.4% which is less impactful given that the average inflation rate over this period was 5.2% giving a real rate of return of 2.2%.
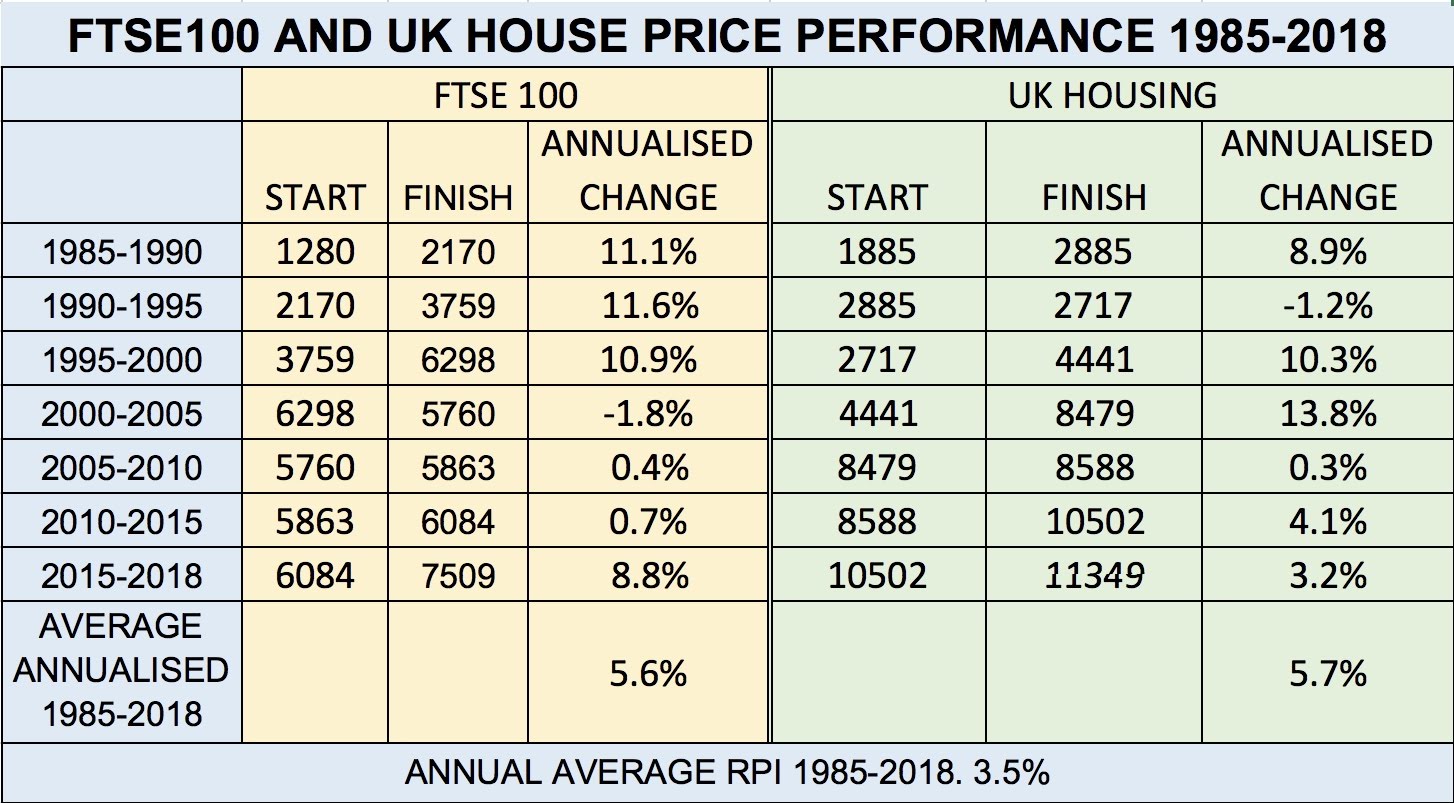
The table below is a comparison of the FTSE100 and UK house prices from 1985 to 2018. The striking feature is that both demonstrate almost identical growth rates over the 33 year period of 5.5% and 5.5% respectively. Taking inflation into account this equates to a real growth rate of around 2%/annum which is similar to the UK´s growth in GDP over the same period.
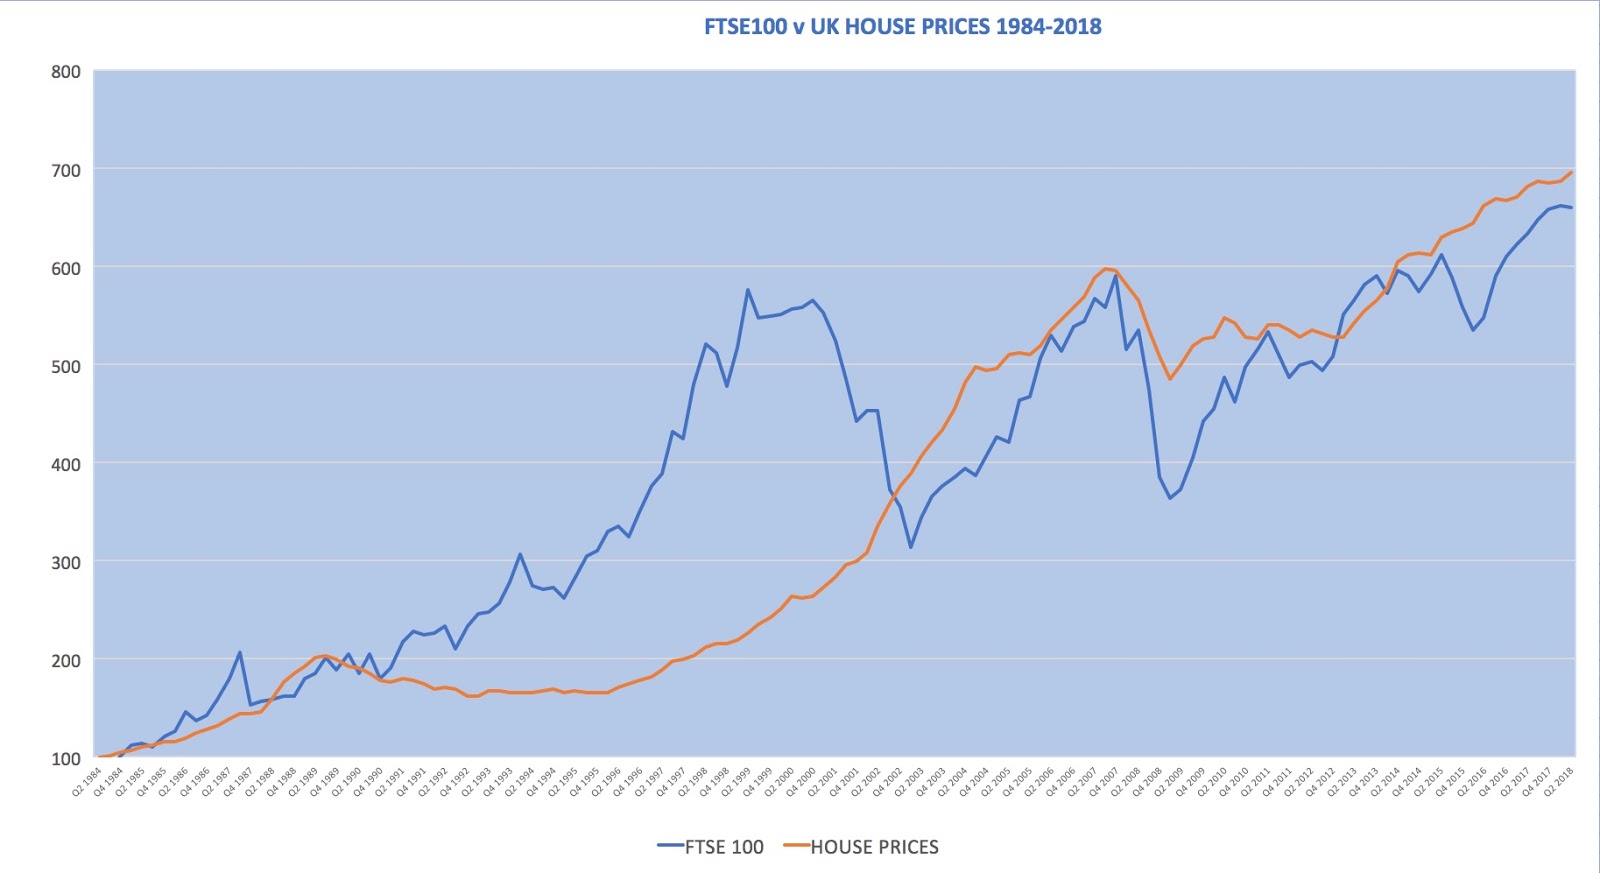
Although long-term growth rates are similar the FTSE exhibits a far greater degree of volatility as illustrated below. If you had had the misfortune to invest in the FTSE at the height of the dot com boom of the 1990´s you would have suffered a 46% fall in the value of your investment and would have had to wait nearly 9 years until 2008 until the markets returned to their pre-crash value - and then immediately afterward you would have suffered from the 2008 financial crisis with a fall of 39% and over 6 years to recover.
Looking further back to 1970 the website Portfolio Charts provides an even clearer illustration of the volatility of the stock market:-
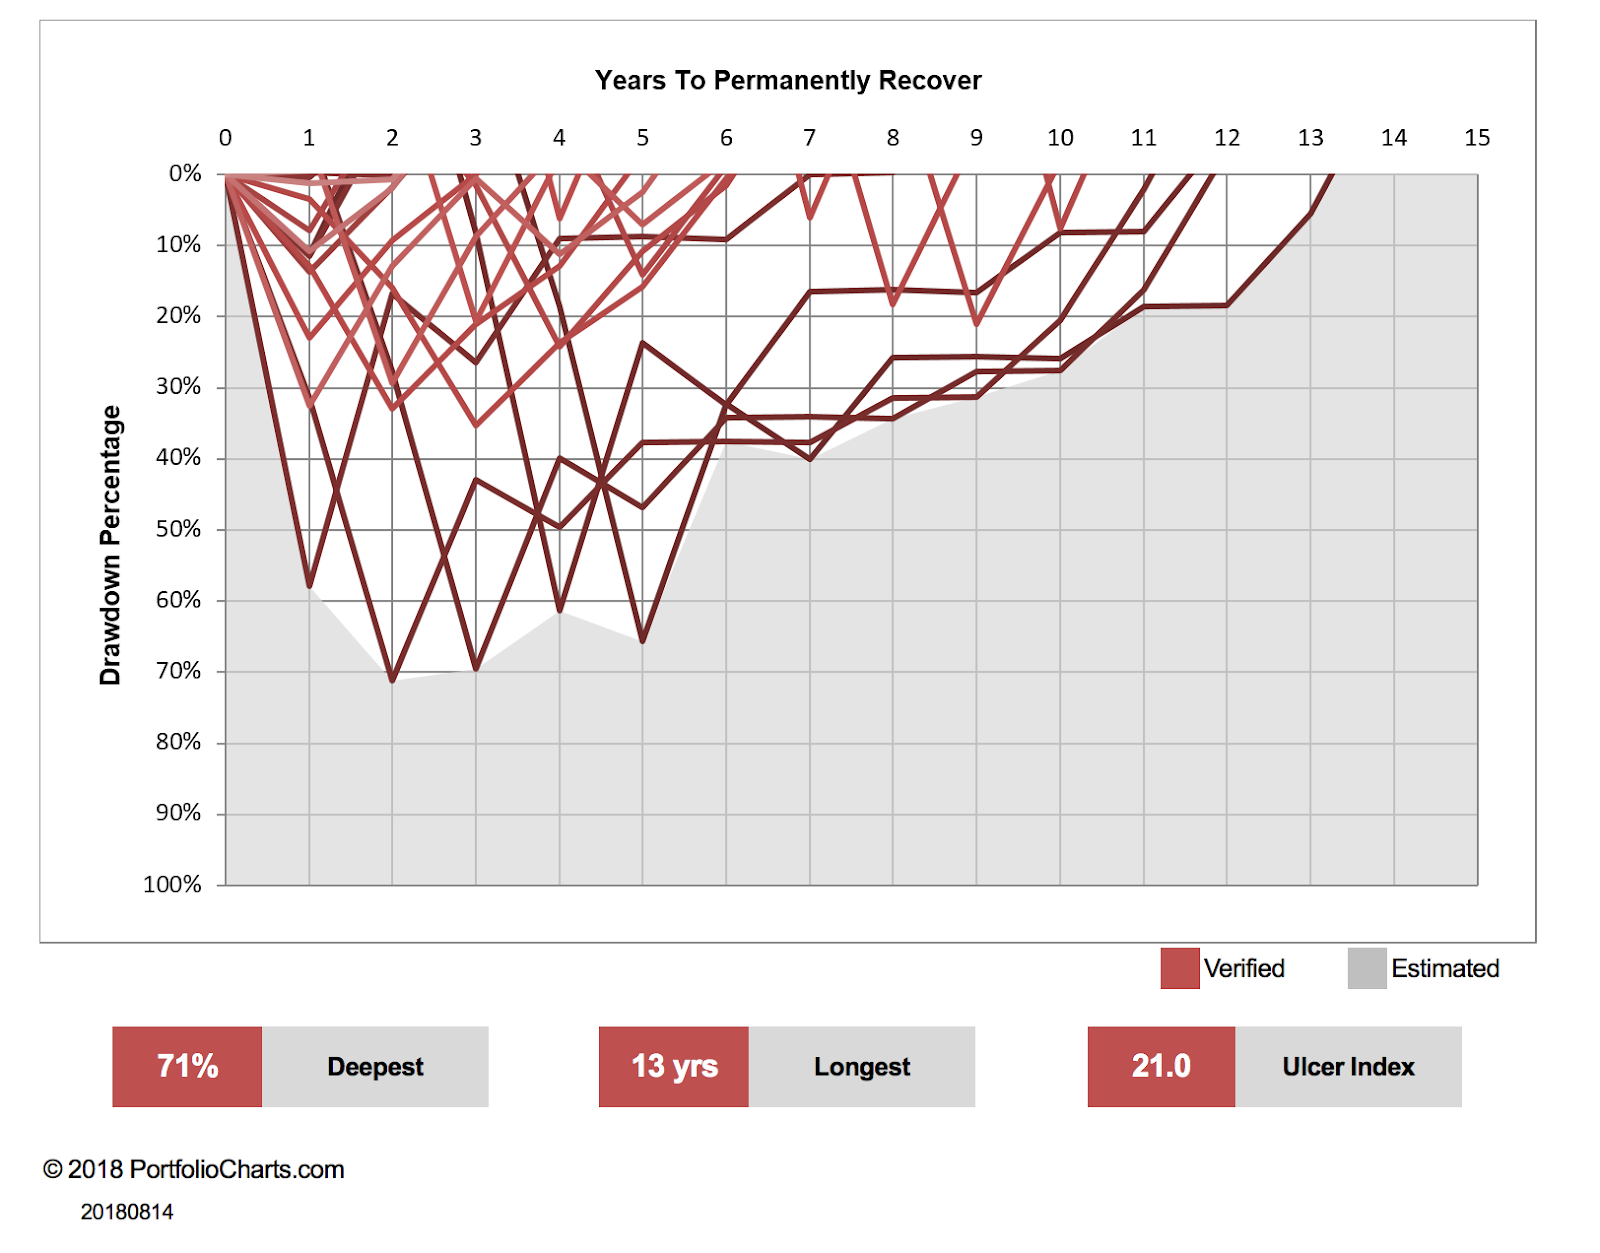
The graphic shows declines in the market at various investment dates together with the time it takes for the market to recover. The worst-case fall being 71% and 13 years to return to its previous level. As all the experts say - the stock market is a long-term investment!
The housing market is far less volatile. Over the last 33 years, there have been two housing crises. The first starting in late ´89 saw a 20% fall in values only recovering by Q1 1998. The second, the financial crisis of 2008 saw a 19% decline in average prices and 7 years to return to pre-crisis values.
Although the severity of the market declines are different if investors in the FTSE or housing had the misfortune to mistime their purchases both would have to wait up to nearly 10 years to recover their investment. And this is in nominal terms not taking inflation into account.
Yield - No account has been taken of the yield available from both the FTSE and housing. There is ample data available about the impact of dividends on total stock market returns. The table below from Schroders shows the effect of dividends on total return for various stock market indices over a 25 year period:-
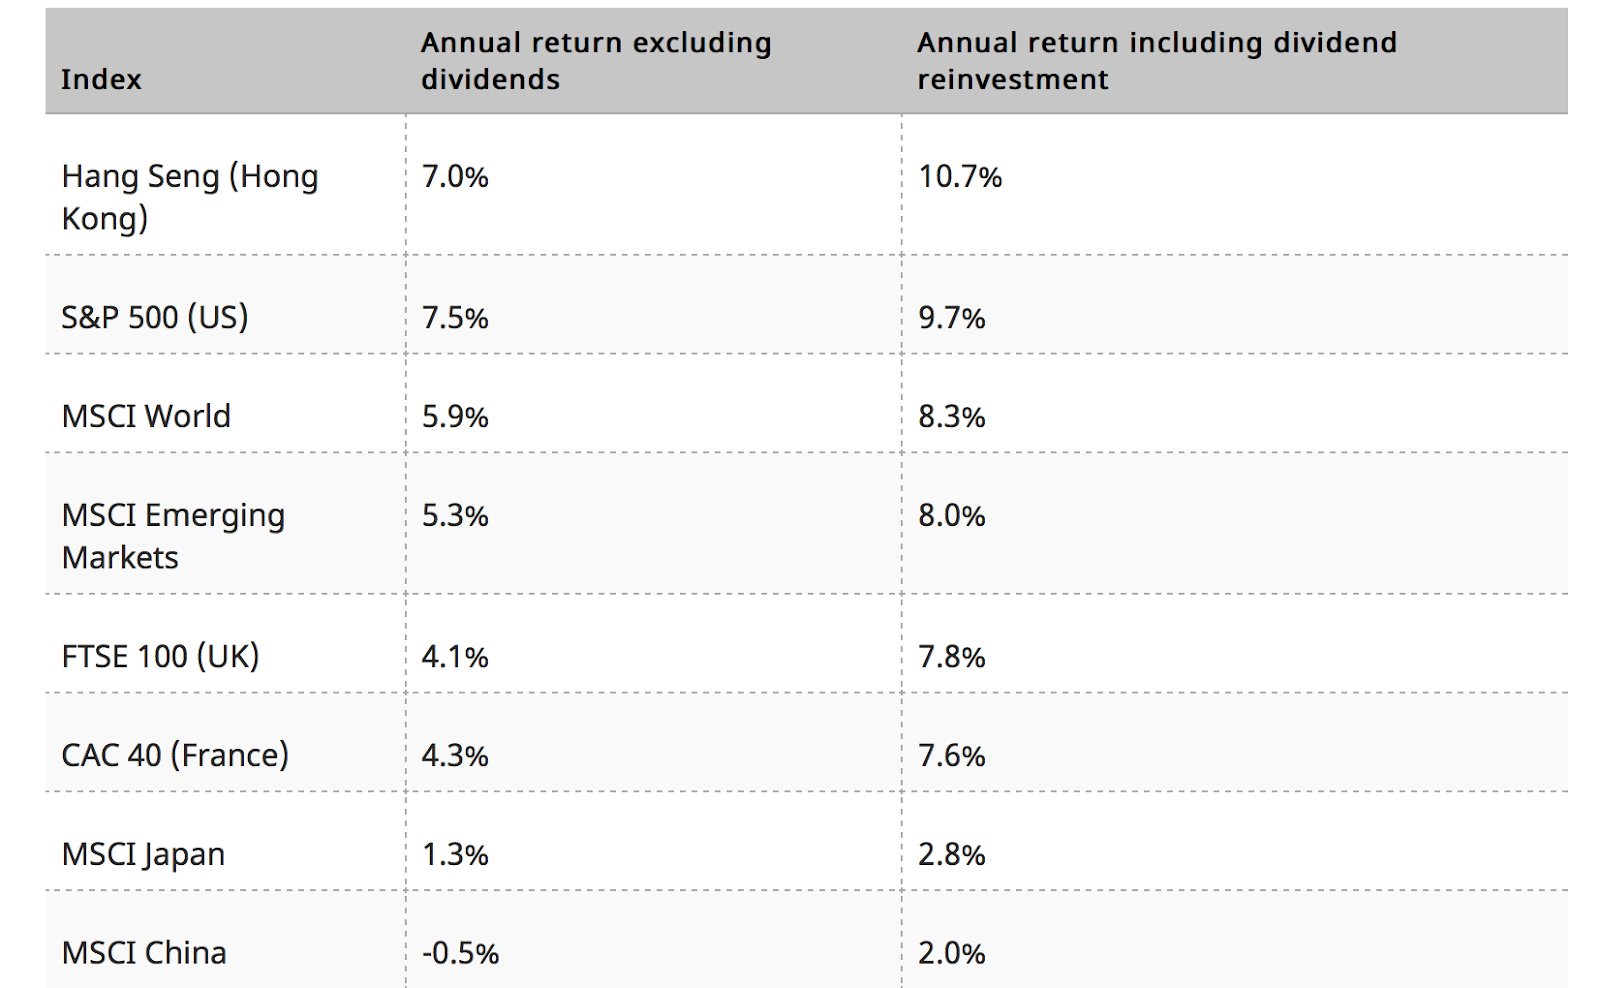
Dividends increased the FTSE100 total return by almost 90%.
Information on yields from the UK housing market is far more difficult to uncover. Gross yields by region and type of property are widely publicised - yields of 8-10% are frequently quoted for some regions. This variation in yield by region can be seen in the Hotspot map from TotallyMoney :-
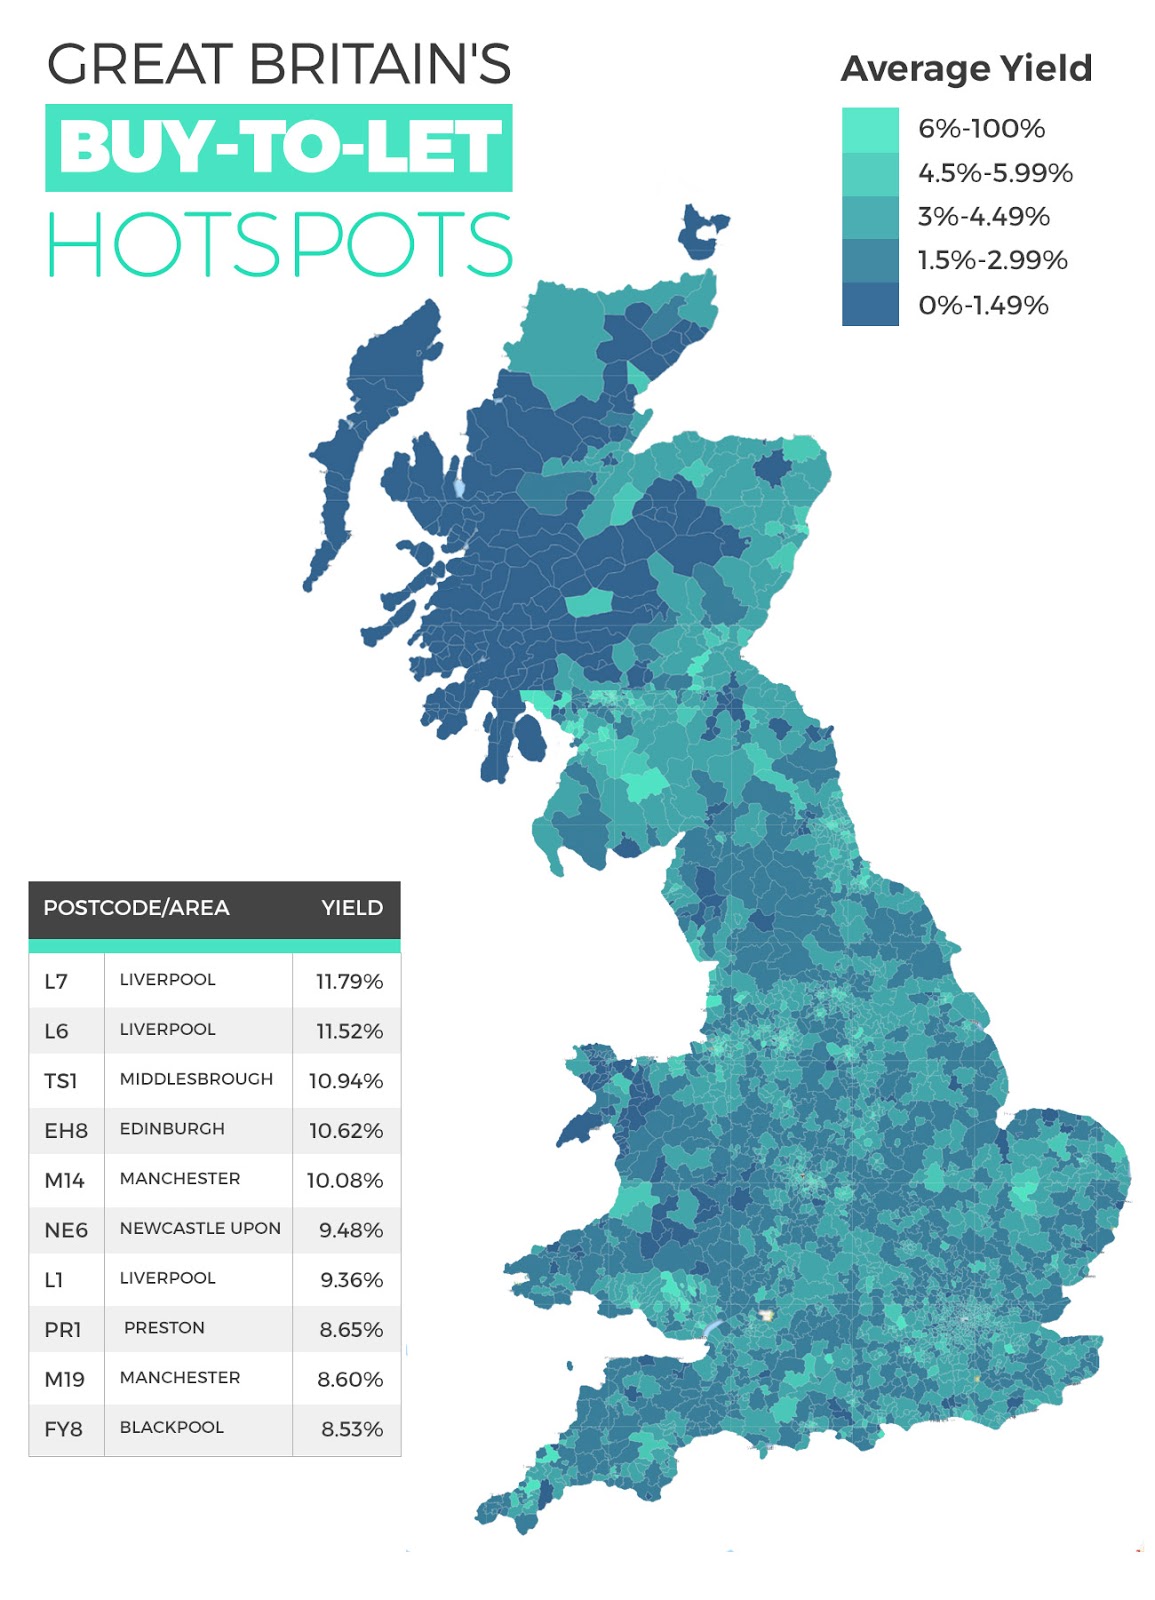
Whilst the UK´s average gross yield is around 5% it can be expected that not only will the professional investor be able to obtain a higher gross yield he will also have lower operating costs resulting in a higher net yield than the accidental or amateur investor can achieve. It is therefore likely that he can equal the 4% or so yield offered by the FTSE100, whereas other housing investors are more likely to obtain 3% or less.
So which is a better investment - housing or the stock market?
Market Timing: Firstly here we are considering the comparison of outright purchase (no borrowings). For most investors in the stock market, this would be an unusual situation as most investors make their purchases over a long period of time through pension schemes or regular savings so it would be extremely rare to make 100% of the investment at the bottom or top of the market. This is not of course true of a house purchase. So whilst the stock market is far more volatile than the housing market it is the house purchaser who is at greater risk of mistiming his investment.
Duration of Investment. Both markets are cyclical and have similar recovery times from a downturn. A minimum investment period of 10 years must be considered for both, and 15 to 20 years is would be a safer timescale. This is especially true of the housing costs where the purchase and sale transaction costs are very high and therefore need to be amortized over a long period.
Long Term Returns. Housing and the stock market have over the last 30 years had similar capital returns of around 2%/annum above inflation. Net yields for both are similar at typically 3 to 4%.
Liquidity. The stock market is highly liquid - one can realise the whole or part of a stock market investment seconds and have the funds in a matter of days. Transaction costs are also extremely low. A house is an illiquid asset that can take months to sell with high transaction costs.
Volatility. The stock market is highly volatile and has experienced falls of up to 70% and up to 14 years to recover. The housing market is less volatile with less severe dips in prices (around 20%) and with reduced but still lengthy recovery periods.
Taxation. The UK stock market investor enjoys many tax concessions such as pension tax relief, ISAs, dividend tax allowances, and annual capital gains tax allowances which allow investors to progressively realise their gains to take advantage of the c.g.t. annual allowance. The tax position for the house investor is disadvantageous both in terms of income taxation and c.g.t..
CONCLUSION - CASH INVESTMENT IN HOUSING OR THE STOCK MARKET?
Provided one is a long-term investor and can tolerate the occasional major downturns of the stock market then the stock market wins out. It provides similar capital gains and comparable or better net yields, negligible management overhead, low transaction costs, and high liquidity.