In preparation for two future posts, I´ve been taking a look at variable withdrawal rates (SWRs) and techniques to maximise safe withdrawal rates (sometimes called Income Harvesting). In order to make some detailed comparisons with conventional inflation-based income withdrawal and annual portfolio balancing, I´ve put together a data set for the UK gilt, stock market, and inflation rates covering the hundred years from 1920 to 2020. For the majority of this period, the data looks at 15+ year gilt rates and an approximation to the FTSE All-share index.
This is a far longer period that is analysed by websites such as PortfolioCharts so should result a more robust piece of research. I thought it might be interesting for some readers to see how SWRs panned out over two periods with 30-year retirements starting every year from 1920-1990 and 1950 to 1990 (as 30 year retirement periods takes data up to 2020, 1990 is the most recent retirement start year that can be analysed ).
Safe Withdrawal Rates (SWR) Based on Zero Failures
I am considering zero failure SWRs – so that there is no retirement period where the money completely runs out – although the portfolio may become worrying depleted in the last few years! As 90% or 95% success rates are more common this is a stricter criterium than is normally applied – but better safe than sorry.
Expenses Accounted For
Total expenses for fund and platform fees are assumed to be 0.3% of the portfolio value taken annually This is probably the minimum that retirees can realistically aim for, but I´ve included a table showing the effect of different fees on SWRs and an indication of just how much is lost through fees over 30 years – the figures were a wake-up call to me!
Effect of Bond/Equity Ratio
The variation of SWR and final portfolio balance with changes in the equity percentage of the portfolio is also examined.
The initial value of each portfolio is assumed to be £100,000.
Results of The Analysis
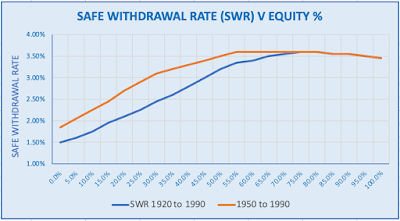
The graph below shows the variation of Safe Withdrawal Rate with the equity content of the portfolio for 30-year retirements starting 1920 to 1990 and 1950 to 1990. Income is adjusted annually in line with the rate of retail inflation (or deflation). Portfolios are balanced annually and assumed fees of 0.3% also deducted annually.
Perhaps not surprisingly as the 1920 to 1990 period encompasses the Great Depression and a World War the SWRs are lower compared to the the1950 to 1990 period. What is very clear is that the optimum SWRs are only obtained with portfolios over-weight in equities. For both periods equity holdings of over 65% and up to 85% produce the highest Safe Withdrawal rates of 3.5% to 3.6%.
These results correlate reasonably well to those published in my post about the 4% Rule which showed that the UK investor should have over 55% in equities to produce a SWR of between 3.8% and 4% – but this excluded charges and covered a much shorter period from 1970 to 1990 – so only 20 complete retirement periods compared with 70 for the 1920-1990 analysis here.
The Problem of Too Much Money!
On average a retiree with a 60% equity portfolio will leave behind £600,000 (in today´s money). After inflation, this is around £250,000. In fact, historically nearly 20% of retirees will have left funds of over a million pounds from an initial investment of £100,000 and this is after taking out an average of over £250,000 in income.
For the majority of retirees, the probability of leaving behind too much money for their heirs (or the taxman) will be far greater than that of running out of money. It is here that Variable Drawdown strategies can provide a superior solution to conventional inflation-linked drawdown. This will be looked at in a post that I am currently preparing.
Expenses
We are all told to minimise platform and fund fees. The table below shows the effect of fees on retirement income and final portfolio value based upon a 60% equity portfolio and a 3.5% withdrawal rate.
A 0.3% expense ratio will cost the retiree £94,000 over a 30-year retirement through less income as a result of a reduced SWR and a smaller final portfolio. A 0.5% expense ratio results in a £163,000 loss.
Every 0.1% in expenses reduces the SWR by 0.05%.
Of course, these numbers aren´t quite as bad as they first appear as it is in today´s money however they do show the importance of minimising platform and fund fees especially considering that on average a retiree will take out around £250,000 in income and could be paying £150,000+ in lost return due to fees!
Volatility and Sequence of Return Risk
We are all warned that sequence of return risk should be one of our greatest worries as retirees, that starting drawdown when the market crashes could destroy our plans for a comfortable retirement.
There are many strategies published that attempt to assess the future direction of the stock market by looking at factors of valuation such as Schiller´s CAPE ratio. However, based upon 100 years of historical market performance and inflation rates we know that a UK retiree with a portfolio of 60% UK equities and 40% gilts could have survived some of the worst economic times with a 3.5% withdrawal rate and on average would have left a considerable inheritance.
It´s worth looking at just how bad some of the economic situations were. Someone retiring in 1973 would have seen his initial £100k portfolio fall to £72K a year later, then the following year to £41K and the portfolio took a further 4 years to recover. During that period annual inflation from 1973 to 1976 was 10%, 19%, 25%, and 15%.
Despite this horrific market performance, the portfolio was able to pay out an inflation-linked income and at the end of 30 years have a valuation of over £450K.
Of course for the retiree, the first years would have been heart-stopping and it’s unlikely that anyone would have been able to happily increase their income by 19% then 25% when their portfolio had collapsed by nearly 60%. But had they had confidence they could have taken the increases without problems.
Most retirees would much prefer not to have to suffer this level of volatility/drawdown. It is however difficult to avoid. Conventional wisdom would suggest an increase in bond holdings. This has a large cost. Reducing equity holdings from 60% to 40% means a reduction in SWR from 3.5% to 2.8% (a 20% reduction in income) but the 1973 retiree would still see a 57% decrease one year after retiring. So a bond-heavy portfolio is no panacea.
There are portfolios such as The Golden Butterfly and The Permanent Portfolio which I have discussed in previous posts that offer far lower levels of volatility and higher SWRs. These succeed in reducing volatility largely through their holdings of gold. This does make research in the years prior to the complete elimination of the Gold Standard in 1973 impossible, so anaylsis of these portfolios cannot have the same level of validity as conventional equity/bond portfolios.
Conclusions
It should be reassuring for UK retirees that based upon 100 years of market history it would have been possible to take a 3.5% inflation-linked drawdown income – providing the equity percentage of the portfolio had been between 65% and 85%.
However, there are two issues of concern: (i) volatility (ii) too much money left behind. The latter (too much money) can be solved using a variable drawdown strategy but the problem of deep drawdowns and high volatility is more problematic. High levels of volatility cannot simply be resolved by decreasing the equity level as this increases the risk of portfolio failure unless the SWR is significantly reduced. The use of a low volatility portfolio such as the Golden Butterfly or Permanent Portfolio may provide the best solution. I will be returning to the topic of strategies to reduce portfolio volatility in a subsequent post.


Hi Max,
Q re drawdown. I was allowing my pension pot to grow and not to draw for a few years, yet this FY I have unused tax allowance plus the pot is performing above expectations. I'm thinking about drawing down a few £k to capitalise on this situation.
Yet I worry about future underperformance – leaving the excess in will offset any future losses. Thus my Q: How to know when today's pot excesses can be taken vs. future underperformance offset?
How do I balance these risks and know how much can be safely pulled?
Thx – Steve
Hi Steve – I do exactly the same as you are planning – drawing down sufficient to use up all my tax allowances. During my accumulation phase, I used a system that you might find useful to judge whether you have excess savings available.
(i) Decide upon a target drawdown pension income. Say £10,000 p.a.
(ii) Adjust this for inflation assuming a notional inflation rate – say 3% inflation and retirement in 10 years' time. This gives a target inflation-adjusted income of £10,000 x (1.03)^10 = £13,439.
(iii) Assuming 3.5% withdrawal rate gives a target fund size of £13439/0.035 = £397,410
(iv) Check where you are at any time with respect to the target by assuming your fund will grow at a certain rate – I used 5.5%
I set up an Excel sheet with the target fund value each year and each year I entered its actual value. If the actual value was below the target value for that year I knew I had to increase my savings rate or delay retirement.
If you prefer not to use Excel then you can easily calculate the target fund size at any time before retirement:-
Min Fund Value=. TFV/(1+gr/100)^yr
TFV is your target retirement fund size, gr is your assumed fund growth rate in %, and yr is the number of years before retirement
So 4 years prior to retirement the Minimum Fund value should be 397410/(1.035/^4) = £346319
This plan worked well for me but it did deliver me the sad news that I couldn´t retire at 60 as I had always planned and had to delay to 65.