


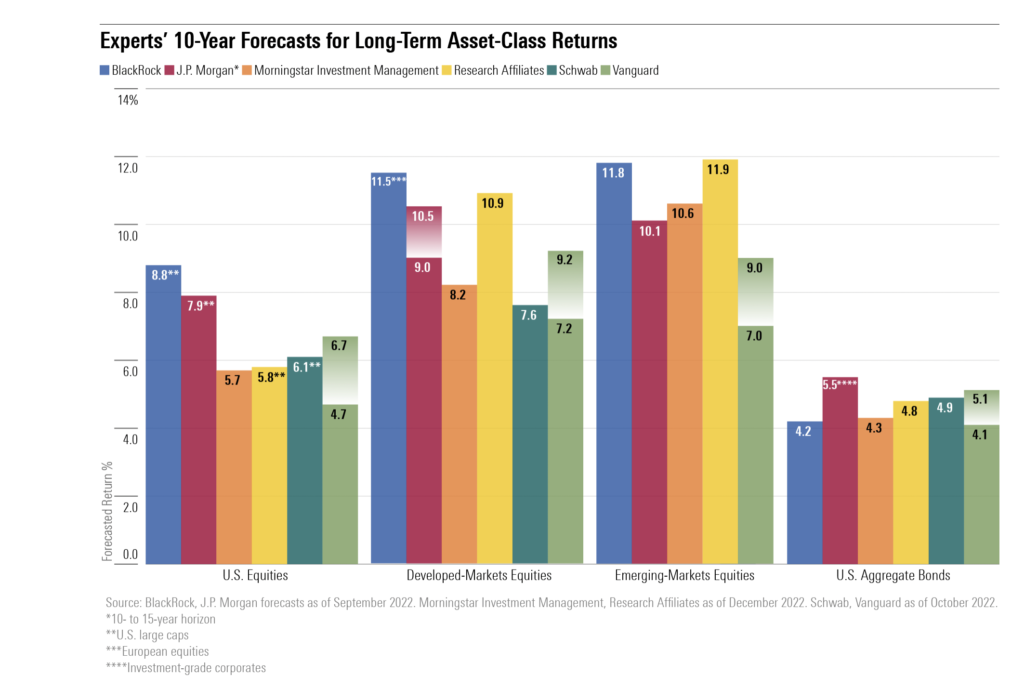
Morningstar`s Survey of Market Forecasts - The US to Underperform
This is the time of year for annual forecasts and Morningstar has surveyed the 10-year predictions of six of the major financial institutions. Although there are variations between the forecasts there is consensus that the US equity market will underperform global markets by 2% to 3% (annualised return), that emerging markets will outperform developed markets, and that US bonds will provide positive returns of over 4%. It should be noted that these are all nominal returns and with US long-term inflation expectations at around 2.5% it looks as though the real US returns are predicted to be around 4% , global returns 6% or so, and US bonds about 1.5%.
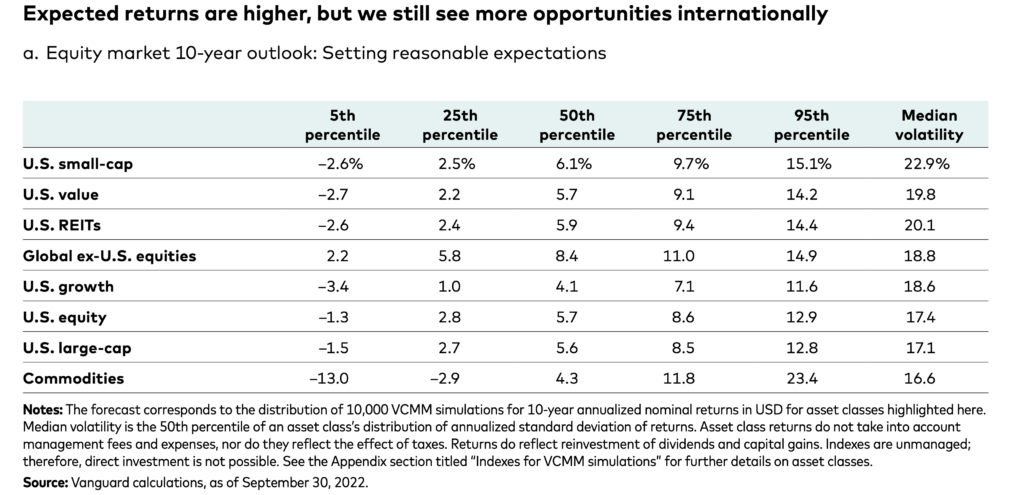
Vanguard has published a detailed 10-year forecast which presents the range of outcomes that it predicts. US small caps are only predicted by Vanguard to marginally outperform large-cap stocks:-
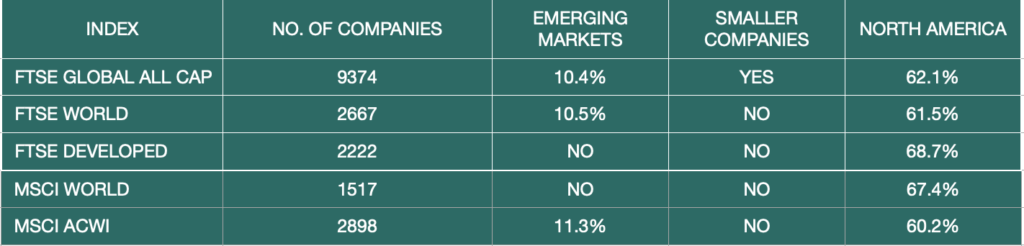
Of course, all of this has to be taken with a fair degree of skepticism as economies are easily derailed by “black swan” events as we discovered with Covid and the Russian invasion of Ukraine. For anyone about to choose a global index fund, it is worth bearing in mind the differences between the major indices which I discuss in my post on Global Indices. I have updated a table that was included in the post that compares the portfolios of the main indices.
The main options for global index funds can be divided into:-
-
-
-
-
-
-
-
-
-
- Developed markets (MSCI World and FTSE Developed)
- Developed + Emerging Markets (FTSE All-World and MSCI ACWI)
- Developed + Emerging + Smaller Companies (FTSE Global All Cap)
-
-
-
-
-
-
-
-
The relative performance is shown in the graph below:-
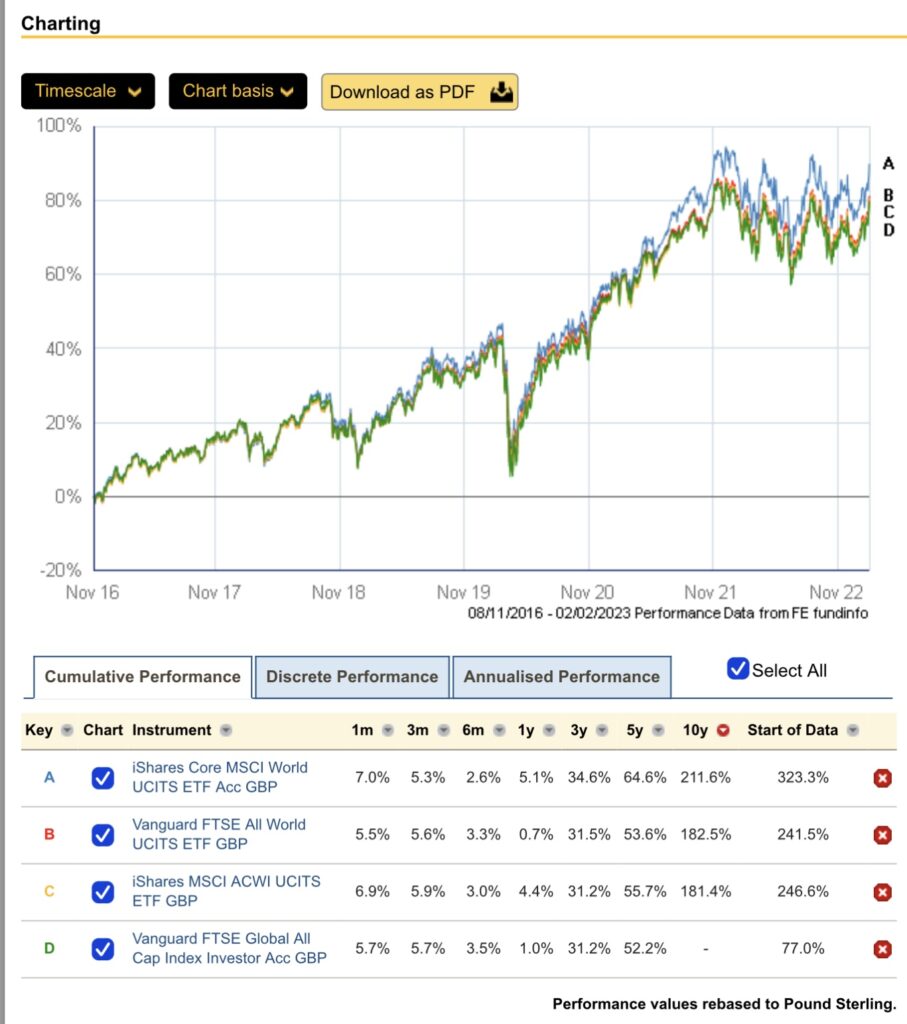
The performance of the US market has been so dominant that over recent years the developed market funds have outperformed the indices that are diversified through holding Emerging Markets and Smaller Companies. If the market forecasts are correct there should be a reversal of this over the next decade. Irrespective of the forecasts conventional wisdom says that the more sectors covered by an index the greater the diversification, lower volatility and the greater the possibility of owning the small percentage of companies that drive market growth (since 1928 4% of companies have fueled the growth of the US stock market - but I guess that like the saying that you only use 2% of what you learn at university -it just takes 40 years to work out what that 2% was!)
From a personal viewpoint, these market forecasts won’t be changing my equity strategy. However, the improved yields of bonds, now around the 3.5% mark means I will be increasing my bond weighting from 30% to 35% which should reduce the volatility of my drawdown portfolio, whilst maintaining the SWR but at the cost of a slightly reduced final balance (sorry family no lives of leisure for you!).
The 4% Rule Doesn`t Work for FIRE
My bugbear and what really niggles me are the gurus of the FIRE movement, (many of whom have become media stars) who persist in saying “save 25 times your expenses and you can retire”. It’s a nice simple message that makes FIRE seem achievable yet it is completely false! Of course, FIRE has become big business with some of the best-known proponents earning serious money through blogs, podcasts, YouTube, books, and media interviews. They are never going to say that it’s not 25 times but probably nearer 50 times your expenses that you`ll need - they don`t want to kill the golden goose.
Where did the 25 times expenses come from? As many people know it is derived from Bill Bengen`s 4% Rule. He showed that based upon historical performance a US retiree could take 4% from a 50/50% equity/bond portfolio, increasing the payout annually by the rate of inflation, and that the portfolio would last at least 30 years. 4% equates to 1/25th hence the 25 times expenses target portfolio size.
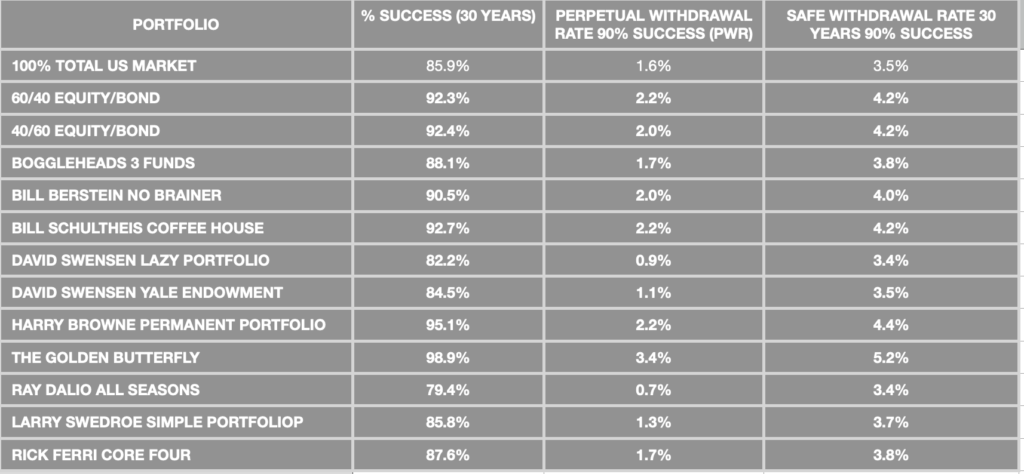
Certainly, a 4% Safe Withdrawal Rate (SWR) over 30 years and with a 90% success rate is feasible for many portfolios. The table below is based upon Monte Carlo Simulations using PortfolioVisualizer and examines a number of US-based portfolio designs using a 4% initial withdrawal rate and shows the probability of not running out of money over a 30-year retirement together with the SWR and the Perpetual Withdrawal Rate (the portfolio is never exhausted).
Bengen Only Looked at 30-year retirement - With FIRE retirement can be 50 years plus. It is not the 30-year SWR that early retirees must look at but the Perpetual Withdrawal Rate. The Perpetual Withdrawal Rates are around 2% - so not 25 times expenses but at least 50 times.
But What about Fees and taxes? Bengen ignored these and often the issue of tax is glossed over by the FIRE bloggers with an assumption that most retirement investment income will be tax-free. Maybe this is true in the US but in the UK most retirees are unlikely to be able to shelter all their income unless they are living pretty close to the poverty line. Fees and broker fees roughly reduce the SWR by half of the expenses %. So if fees are 0.4% the SWR reduces by 0.2%. If a portfolio is able to sustain a 4% SWR on a gross income basis this will be reduced through tax and fees.
(Of course, Bengen is envisaging a far from real retirement scenario and it is probably on the pessimistic side. The need for income is not constant throughout retirement. It tends to decrease as one gets older perhaps increasing in the latter years due to health issues. In fact, Morningstar in their analysis of Dynamic Withdrawal techniques found that annual increases in income by (Inflation -1%) were a better match to actual retirement spending patterns. Also, here is the assumption that spending is independent of the performance of the portfolio. This is clearly not true. If there is a market crash a retiree will adapt his spending to the new economic conditions)
So once the realities of a Perpetual Withdrawal Rate, Taxes, and fees are taken into account it is clear that the “25 Times Expenses” manta is nonsense!
Now having said that I am confident that the vast majority of people who are several years into their FIRE journey are well aware of this. Some of the most financially astute contributors to forums such as Reddit are from the FIRE community. For many FIRE isn’t about the “RE” (retire early) but the FI (financial independence). Having 25 times expenses in investments provides a large degree of freedom to pursue alternative careers, reduce working hours, take a stress-free low paid job, develop side hustles or simply eliminate career pressure by knowing they have a substantial financial safety net. Most retirees early or otherwise will have multiple sources of income and will not be 100% dependent upon portfolio performance.
Tax-Free Retirement in the UK?
The UK tax position is complicated. It is quite possible that an early retiree will bridge the period between retirement and private and state pensions kicking in by using ISAs which are tax-free (currently!). Pension income is taxable so once the retiree starts to access income from private and state pensions it is difficult to avoid paying some tax. Clearly, the greater the need for income the greater the difficulty in minimising tax liability.
In the UK, it was quite common to see articles promoting the generous tax treatment of retirees:-
-
-
- Person allowance £12,570
- Dividend allowance £2000
- Interest Allowance £1000
- Capital Gains Allowance £12,300
-
This gave a total annual tax-free allowance of £27,870 or £55,740 for a couple plus any income from a tax-sheltered ISA. In fact, as I explained above it is difficult to avoid paying some tax as soon as pension income is taken, and with frozen personal allowances, the reduced CGT and dividend allowances, and the threat of restrictions on ISAs it is certain that retirees need to plan for a greater tax hit.