There can be few potential or actual retirees who are not aware of Bengen´s 4% rule that says you can withdraw an initial 4% from a retirement portfolio and increase this annually by the rate of inflation with negligible risk of running out of money over a 30-year retirement. Within the FIRE financial freedom community, this rule is often expressed differently (maybe optimistically!) by stating that financial freedom is achieved when you have savings greater than 25 times your annual expenses.
Whilst many drawdown retirees worry about running out of money research from Michael Kitces shows that the 4% rule would have survived even during the Great Depression, Wall Street Crash, and two World Wars and that for many the problem is not spending too much but spending too little. Kitces states:
“by applying the 4% rule, over 2/3rds of the time the retiree finishes with more than double their wealth at the beginning of retirement “
The 4% rule is enormously significant for a retiree as it forecasts his prospective income and may also determine the age at which he has accumulated sufficient savings enabling him to give up work. In this post, I´ll look at the origins of the 4% rule, its validity, and in particular its validity for retirees outside of the USA.
Origin of the 4% Sustainable Withdrawal Rule (SWR)
William Bengen´s 4% rule is so ingrained in retirement planning that it is difficult to believe that it was first proposed as recently as 1994 in Bengel´s revolutionary paper “Determining Withdrawal Rates Using Historical Data“. Prior to this paper financial advisors used average equity and bond returns and average historical inflation rates to produce retirement plans for their clients, ignoring the effects of market volatility with the inevitable consequence that many of these plans would fail with serious consequences for the retirees.
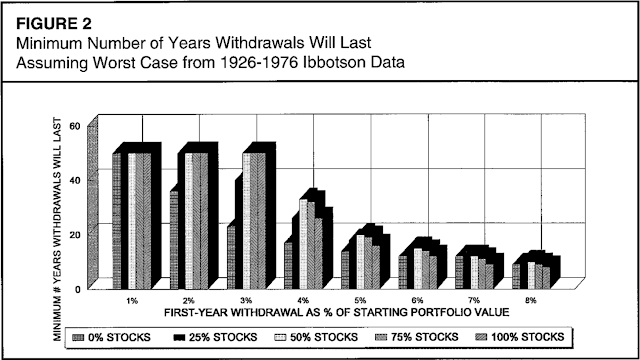
Bengel analyzed actual historical returns for 50 retirement start years from 1926 to 1976, different bond/equity ratios, and different withdrawal rates. He discovered that with a 50/50 intermediate treasury bond/equity portfolio and a 4% initial withdrawal rate adjusted annually for inflation-adjusted that all 50 retirement periods would have survived a minimum of 33 years and in 40 of the 50 cases, the portfolios would have lasted at least 50 years and only 5 would have survived less than 40 years. Failures occurred only if the initial withdrawal rate was increased to 4.25%.
The 4% Rule Doesn´t Take Charges Into Account
Perhaps surprisingly Bengel didn´t take fees into account in his analysis – maybe then like now it was a topic often skated over by financial advisors! Allowing for fees would reduce the safe withdrawal rate typically by around 0.1% to 0.25%.
Optimum Equity Content 50% to 75%
25 Years On How Has The 4% Rule Performed?
Results Using Historical backtesting Analysis
Monte Carlo Simulation
Does The 4% Rule Work in All Countries?
Most research into the 4% rule has focussed on the USA and over the last few years, many commentators in the UK have suggested that the 4% rule is not valid for UK retirees and that an SWR of 3% or less is more appropriate.
This issue is addressed in an article by Wade Pfau “Does the 4% Rule Work Around the World” that examines safe withdrawal rates by country over the period 1900-1986 and how this is affected by varying the equity component of the portfolio. The graph below is reproduced from his article and shown the variation of SWR by equity content for 21 countries.
The UK investor is not so fortunate. The maximum SWR of 3.75%is achieved with an 80% equity content and this declines to 3.36% with a 50/50% portfolio. The UK investor can only maximise his income potential by accepting more volatility through a higher equity content.
Using data from Portfolio Charts the graph below compares SWRs from the USA and UK for different equity content. Results will inevitably be different between the two analyses due to differences in data sets and time range but there is a broad correlation confirming that the UK retiree has a lower SWR than the US retiree and that his maximum SWR is realised by having between 50% and 70% in equities.
CONCLUSIONS
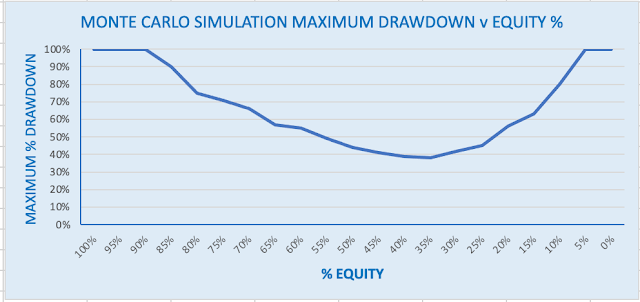
There is significant evidence that for US retirees with portfolios based upon total US stock market and intermediate treasuries the 4% rule holds up well providing they hold 30% or more in equities and minimise costs. Willam Bengel considered the ideal to be between 50% and 70%. The higher the equity component the larger the final portfolio value but the higher the volatility. As always a balancing act between risk and reward.
UK investors are not so fortunate with safe withdrawal rates at least 0.5% lower than the US and portfolios must have an equity component of between 50% and 75% to maximise the SWR. The UK retiree is further impacted by higher platform and investment fees. Allowing for costs an SWR in the range of 3.25% to 3.5% would be the maximum for the UK retiree with a UK total stock market (FTSE All Share) and 10-year gilt portfolio.
The 4% rule is based upon having a bond/equity portfolio with periodic rebalancing to maintain a fairly constant bond/equity ratio and consequently, a reasonably well-defined risk profile. There are other strategies that aim to maximise the SWR by varying the bond/equity ratio in accordance with market conditions.
What has to be remembered is that the probability is that 90% or more of retirees having chosen an initial safe withdrawal rate will have funds remaining at the end of their lives – some retirees will end up leaving portfolios many multiples of their initial values. For many, this will be a desirable outcome – a large inheritance for their heirs but for others this would mean foregoing a better quality of retirement.
The converse unfortunately is also true. There is always a remote possibility of some catastrophic event occurring that could ruin any chance of the portfolio surviving the lifetime of the retiree if he blindly follows the 4% withdrawal rule. Normally common sense would win out in these situations and the retiree would reduce his withdrawals and if necessary, adapt his lifestyle to a reduced level of income.
Variable Withdrawal Strategies play a useful role in enabling increased withdrawals if the portfolio is outperforming and highlighting the need to reduce drawdowns when the portfolio is underperforming. A good Variable Withdrawal Strategy can minimise both the probability of leaving too much inheritance and of running out of money. In future posts, I´ll discuss Variable Withdrawal Strategies and alternatives to periodic rebalancing.


