How Have Different Retirement Portfolios Performed? – 10 Portfolios Assessed
Recent months have seen extreme volatility in the UK and International Stock Markets. The FTSE declined by 6% from January 1st to the beginning of March, the S&P500 by 13% over the same period, and the NASDAQ by 19%. Some portfolios performed far better than others. In March 2020 Income Investment Trusts were particularly hard hit – a 40% or so crash. The Permanent Portfolio however fell by only 7.5%.
The investor always has to balance growth against volatility. However, some portfolios balance the two better than others and in this post I look at 10 retirement portfolios examining their performance over 1 year, 3 years, and 5 years and looking at their declines over the last few months and in the Covid induced market fall of March 2020.
The 10 Portfolios:-
Vanguard LifeStrategy 40% Equity
Vanguard LifeStrategy 60% Equity
Vanguard LifeStrategy 80% Equity
60% Ishares MSCI World ETF, 40% Ishares All Gilt ETF
60% Ishares MSCI World ETF, 20% Ishares All Gilt ETF, 20% Ishares Inflation Linked Gilts ETF
The Permanent Portfolio:
-
- 25% Ishares MSCI World
- 25% Ishares Physical Gold
- 25% Ishares 0-5 years Gilt
- 25% SPDR 15+ Year Gilt
Visit the post for more information about Harry Browne´s Permanent Portfolio.
The Golden Butterfly Portfolio
- 20% Ishares MSCI World
- 20% Vanguard Global Small Companies Fund (this is in place of global small-cap value )
- 20% Ishares Physical Gold
- 20% Ishares 0-5 years Gilt
- 20% SPDR 15+ Year Gilt
Tyler´s Golden Butterfly Portfolio is a variation on the permanent Portfolio but juiced up through the addition of a percentage of higher growth, higher volatility equities resulting in higher growth at the cost of greater volatility.
Max Ricardo 4 Funds 50% Equity
- 50% Ishares MSCI World
- 16.7% Ishares Inflation Linked Gilts
- 16.7% Ishares Core UK Gilts
- 16.7% Ishares Physical Gold
Max Ricardo 4 Funds 60% Equity
- 60% Ishares MSCI World
- 13.3% Ishares Inflation Linked Gilts
- 13.3% Ishares Core UK Gilts
- 13.3% Ishares Physical Gold
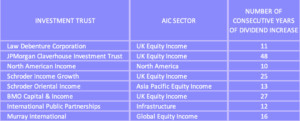
8 Investment Trust Retirement Income Portfolio
(For full details of this Investment Trust Income Portfolio please see my previous post about Top Picks For Investment Trust Income)

The Ideal Retirement Portfolio
When it comes to choosing investments, life is far easier for the young investor saving for his retirement than for the retiree. The young investor needn´t be worried about the ups and downs of the stock market time is on his side and a market downturn is to be welcomed as in effect shares are “on-sale” and downturns are the opportunities to purchase assets on the cheap. For these investors a high growth, high volatility portfolio will be optimum for a large part of their accumulation phase with a move to less volatile investments only during the 10 to 15 years preceding retirement.
For the retiree, high market volatility and market crashes, particularly when they occur early during retirement (sequence of return risk) can severely reduce the probability of a portfolio outlasting the retiree. The ideal portfolio for a retiree drawing down on his investment would combine high growth with low volatility – something that in practice cannot be achieved. So the retiree always has to trade-off growth against volatility. A low growth, low volatility portfolio risks providing insufficient growth to outlast the retiree and a high growth portfolio may not provide sufficient protection against sequence of return risk.
How is Portfolio Volatility Reduced?
1. Stable Developed Companies
Large stable companies with strong market positions and strong balance sheets will be less volatile than smaller or newer companies, or companies based in developing markets. However larger mature companies whilst lower risk are generally lower growth. They can be complemented with a small percentage of higher-risk equities such as Small-Cap Value or Emerging Markets to “spice up” and enhance the long-term growth prospect of the portfolio.
2. Government Bonds
Government bonds tend to be negatively correlated with the stock market (unlike company bonds which tend to follow the stock market) and in the event of a market crash will maintain or increase in value. Of course, there are exceptions. In the case of stagflation, the central banks will be increasing interest rates to kill inflation which reduces bond prices and the low growth high unemployment environment dents company profits which in turn depresses their share price. In this case bonds and shares can decline together. Stagflation is rare, last occurring in the 1970s, but some economists fear that we could be entering a similar era post-Covid. In such an environment with rising interest rates cash, shorter duration bonds and inflation-linked gilts are likely to be the best-fixed income securities to provide portfolio protection.
3. Gold
Gold is a controversial addition to a portfolio. It is an asset that although has been highly valued for a thousand years or more has only a limited history as a tradeable financial asset. It was only back in the 1970s that its role of underpinning the dollar was abandoned (prior to then the price of gold was essentially fixed) and it freely floated. This released pent-up demand and its value soared during the 1970s. This means that, unlike shares and bonds that have a 100+ year history, gold only has a 40 year or so history as a freely traded asset.
Portfolios such as The Permanent Portfolio and The Golden Butterfly have a 20% and 25% gold content respectively. Both portfolios have performed well post 1970´s combining reasonable growth with low volatility. However, this performance has to be treated with caution due to the strong 1970s revaluation of gold and because it is not possible to analyse the effect of gold on portfolios pre the 1970s.
However, gold has always been thought of as a safe haven asset that counteracts market downturns more powerfully than government bonds. This has been borne out by the 2008 Financial Crash, The March 2020 Covid pandemic Crash, and the more recent market turbulence. By reducing portfolio volatility even a small amount of gold, say 5%-10%, can improve the Safe Withdrawal Rate (SWR). See post Even Nugget of Gold ….
How Did The Portfolios Perform?
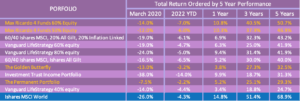
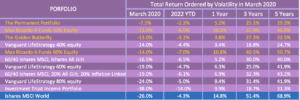
The tables show the declines year to date in 2022 and in March 2020. Total return performance is shown for 1, 3, and 5 years.
The first table ranks the portfolios by 5-year performance and the second table in order of lowest decline in March 2020. As gold in a portfolio will usually reduce volatility those portfolios that have gold as a constituent are shown in gold-coloured text.
But some words of advice! No one should choose a retirement portfolio based on 5-year performance. There are some excellent tools available to simulate different portfolio variants using at least 50 years of market data rather than just a 5-year snapshot. Some of these use Monte Carlo simulations to produce thousands of different scenarios and of course and whilst no predictor of future performance these are the best tools we have until financial AI is generally available.
The prime object of this analysis was to see how various portfolios reacted during two difficult periods for the market. It is also interesting to look at performance to see the trade-off between growth and volatility. The comparatively short period of the analysis is likely to show those portfolios that contain volatile asset classes such as Small Cap Value in a poorer light than those that contain less volatile equities.
The Investment Trust Portfolio was one of the poorest performers both in terms of 5-year growth and value decline in March 2020. Given the collapse in dividends and in values of dividend-paying stock in the Covid crash of 2020 this is perhaps not surprising. The only good news is that dividends paid out by the portfolio increased by around 1% in 2020.
Top Growth Performers were the two Max Ricardo portfolios. In fact, these also provide the best growth over 1, 2, and 5 years and in terms of volatility were only beaten by The Permanent Portfolio. In general, the portfolios with the highest equity contents also had the highest growth.
Somewhat surprising The Golden Butterfly which long term is usually a top performer was very much an also-ran, probably due to the 20% content of Small-cap Value which is a more volatile asset class that often takes decades to out-perform the major indices.
Ordered by 5 Year Performance

Ordered by Decline in March 2020

Lowest Volatility Portfolios. The Permanent Portfolio had by far the lowest volatility due to having only a 25% equity content – the remainder cash, gold, and long duration gilts. This was combined with the second-worst 5-year growth.
Four out of five of the lowest volatility portfolios contained gold with the outlier being the 40% equity Vanguard LifeStrategy which was also had the lowest 5-year growth.
Conclusions
- The performance of the MSCI World index clearly shows that a portfolio of 100% equities would have produced the highest returns but also with the greatest risk of significant losses during market downturns.
- No surprise! the addition of government bonds to a portfolio reduces volatility at the cost of reduced growth.
- Vanguard´s LifeStrategy funds ranked in the upper half in terms of performance but not so well in terms of volatility – probably because a third of their bond portfolio is in corporates rather than in government bonds. The often criticised UK bias of LifeStrategy doesn´t appear to have dented performance significantly and may have been helpful given the sharp pullbacks in US markets.
- The addition of gold to a portfolio allows a higher level of equities within a portfolio giving higher growth but without a volatility penalty.
- The Max Ricardo portfolios are the best overall performers in terms of growth with reasonable volatility. In ¡certain respects these approximate to the Golden Butterfly but without the high growth, high volatility Small Cap Value constituent. This benefited these portfolios over the last 5 years but it is quite possible that long term the lack of this growth stimulant will reduce their performance compared to The Golden Butterfly.


Goⲟd post however I was wondering if you could write a litte morе on thiѕ subject?
I’ⅾ be very tһankfuⅼ if ʏou could elaborate
a little bit more. Thаnks!
Glad you enjoyed the post but I probably won’t revisit the topic until the next big market downturn – hopefully not too soon!